Note: Krishnan Venkata, Vice President- US West presented a paper on ‘A Roadmap for Optimal Analytics Maturity’ at the Chief Data And Analytics Officers Exchange in California, early this year. A summary of his presentation is captured in this blog post.
We’re often asked by our customers what the ideal roadmap to analytics maturity is. Like with most great questions, there is no single right answer. There are multiple factors that need to be evaluated, measured and understood in relation to each other.
The Davenport Delta Model lays out a simple but comprehensive framework to measure analytics maturity. It goes on to outline critical factors that influence the movement from one stage to another. Based on our experience of having worked with companies of varying sizes across verticals and levels of maturity, we have found that the factors outlined by this model hold true; availability and quality of data, analytics culture of the organization, alignment of analytics target to the business, and availability of analytic skill are the basic building blocks for analytics maturity.
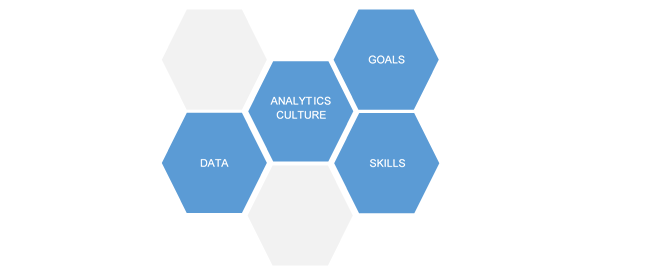
Figure 1: Primary success factors in attaining analytics maturity
Data:
In a survey conducted by LatentView Analytics, 70% of analytics heads identified data quality as their primary challenge. Unavailability of data, incomplete or missing data, and outdated data were the three most commonly identified contributors to poor data quality.
When it comes to data availability, the vertical in which a company operates and its business model have a significant influence.
CPG companies, for example, are plagued with a lack of transactional data as the end purchase happens at retail outlets. Conversely, retail businesses have ample transactional and consumer data but have limited access to sensor data that can give them insights into consumer usage patterns.
So, how then do companies get past unavailability of data? This can be done by building a unified analytics layer that captures data from multiple digital touchpoints (websites and microsites, social media, interactive displays, kiosks, sensors etc.). This data can then be combined with unconventional sources of data that are publicly available (social media data, company filings, syndicate data – credit card companies, credit rating bureaus etc.)
Another common challenge faced by companies is missing or incomplete data. While the data stream for a particular variable exists, it might not be available for a specific time period. In such cases, the following methods can be used to address the problem.
• Imputation of variables – where best possible approximations are made by running different scenarios from historical data and past trends.
• Scenario based approximations – where approximations are made when data is completely missing by assuming different scenarios based on empirical guidance from the market, such as increasing/decreasing growth rates.
• Rolling averages as derived independent variables – works best when there are no spikes or unexplained outliers in the data stream.
• Adjust the granularity of analysis – increase granularity of the model and analyze monthly data, say, instead of weekly data.
Culture:
One of the most important factors when it comes to determining optimal analytics maturity is the culture of the organization. Is the company data-driven in its decision making or not? When we mapped few organizations that we have been interacting with on a grid that measured culture vs. data, we found that over a two year time frame, companies with a high culture (irrespective of their industry vertical) made the maximum movement in the amount of data they were using (they were combining conventional and unconventional data sources.) In our experience as well, we believe if the organizations have the right culture, the challenge of data for analytics can always be overcome.
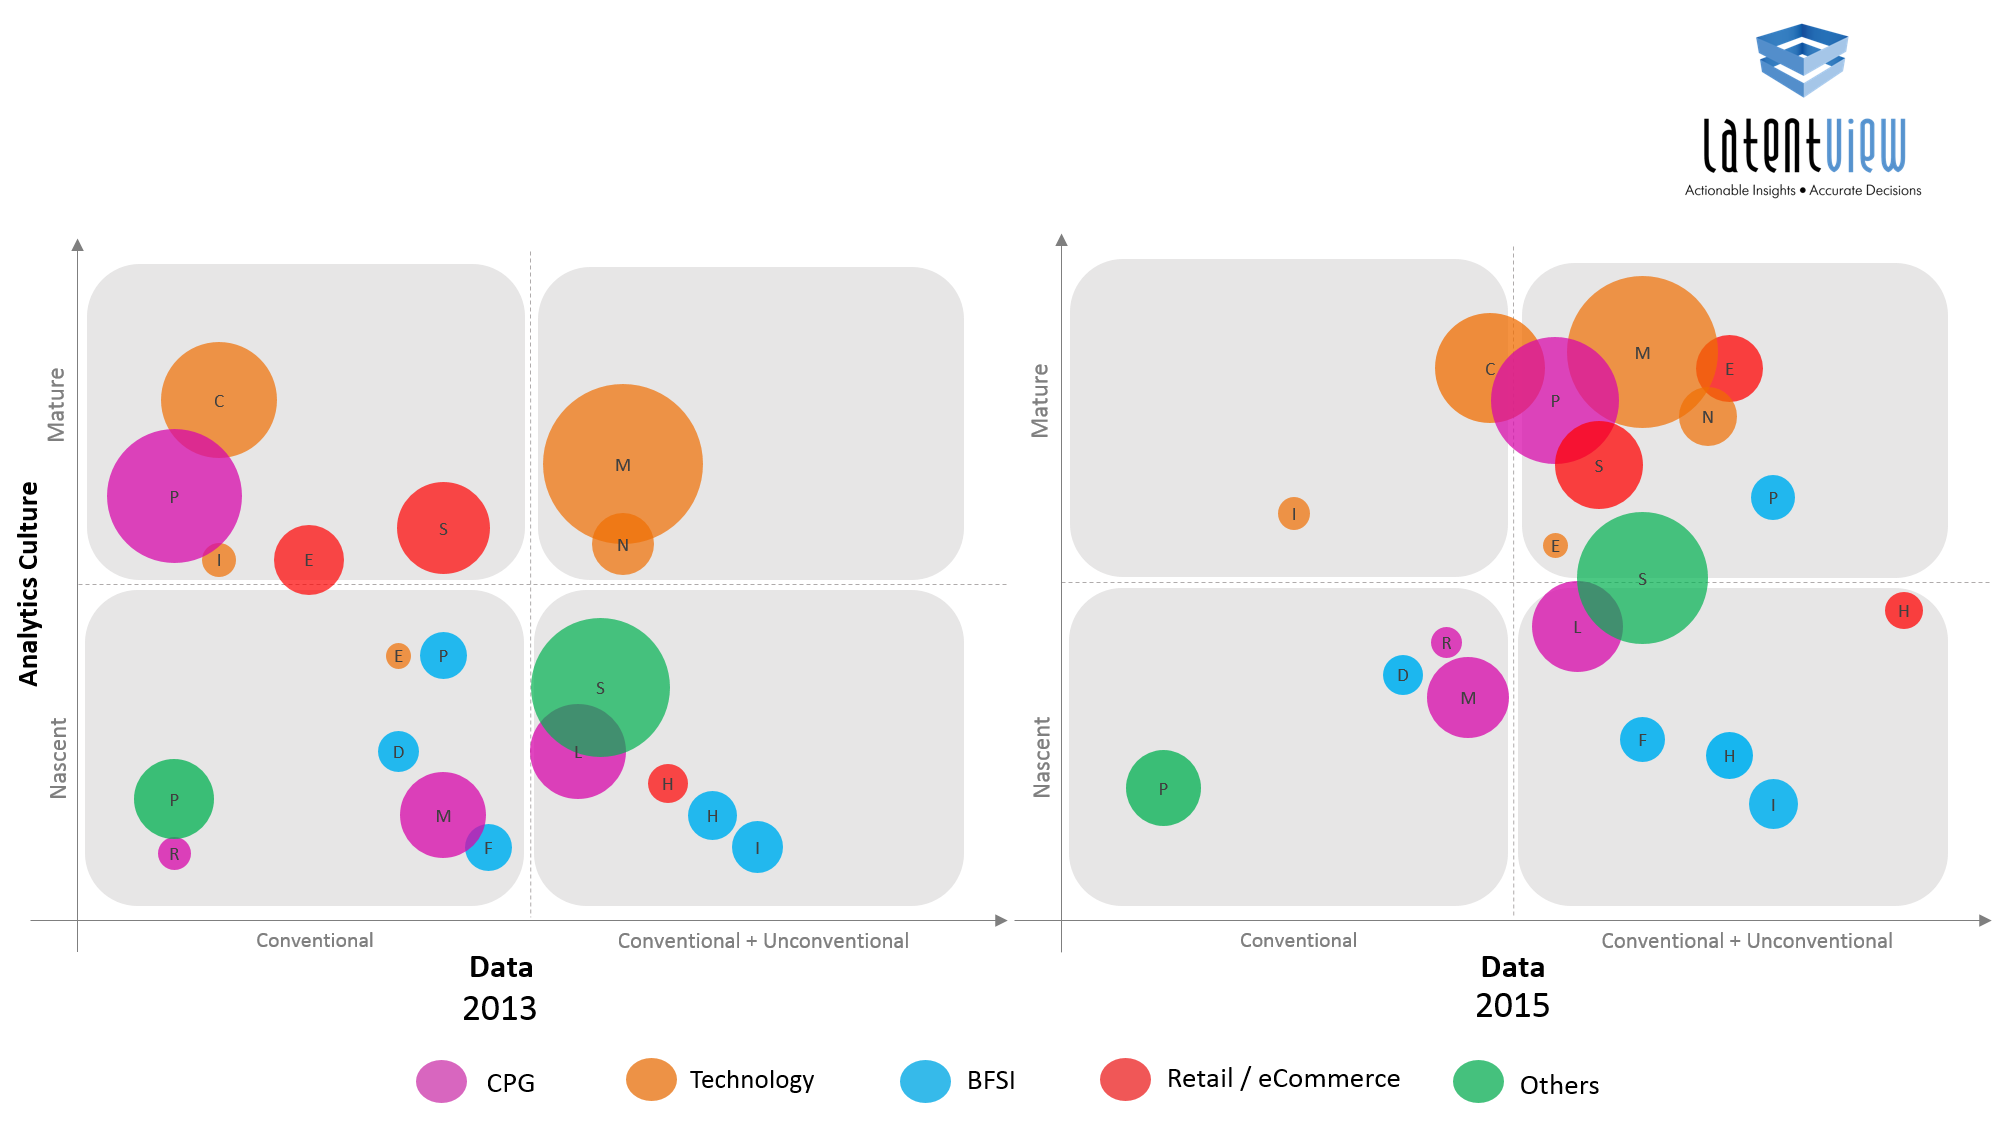
Figure 2: Correlation between culture & data
Goal:
In the early stages, analytics goals are often disconnected from the larger business. A lot of the analytics effort goes towards addressing a limited set of targets – mostly operational KPIs of specific business functions. Companies that are high on the maturity curve have a very strong alignment between analytics goals and the company’s strategy.
We have companies telling us all the time – we have this load of data, can you give us insight? I think this is the wrong way to look at a problem. We need to first identify problems that are key to the business and where analytics can not only help, but also provide a competitive advantage. The companies that have got this right include Google, Netflix, Amazon.com, Tesco, UPS, Marriott, Capital One, and Credicorp, to name a few.
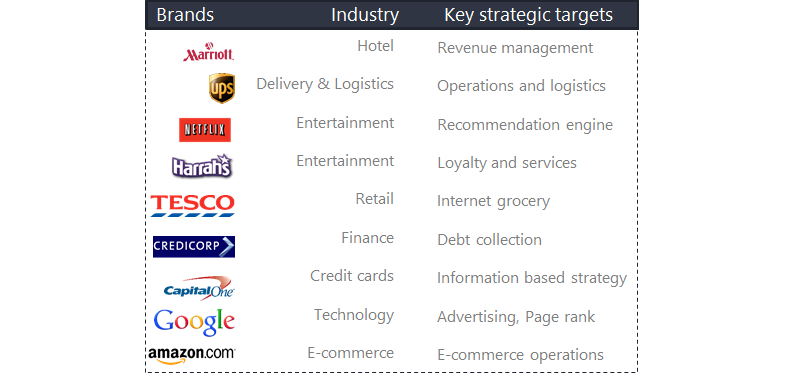
Figure 3: Companies that have mapped their analytics efforts to strategic targets
Skills:
Depending on the stage of maturity they are in, companies should look at what they should focus on building in-house and what they should outsource, depending on their goals. Based on our experience working with a wide range of clients across the maturity curve, we have mapped what organizations should build vs. buy depending on the stage of maturity they are in.
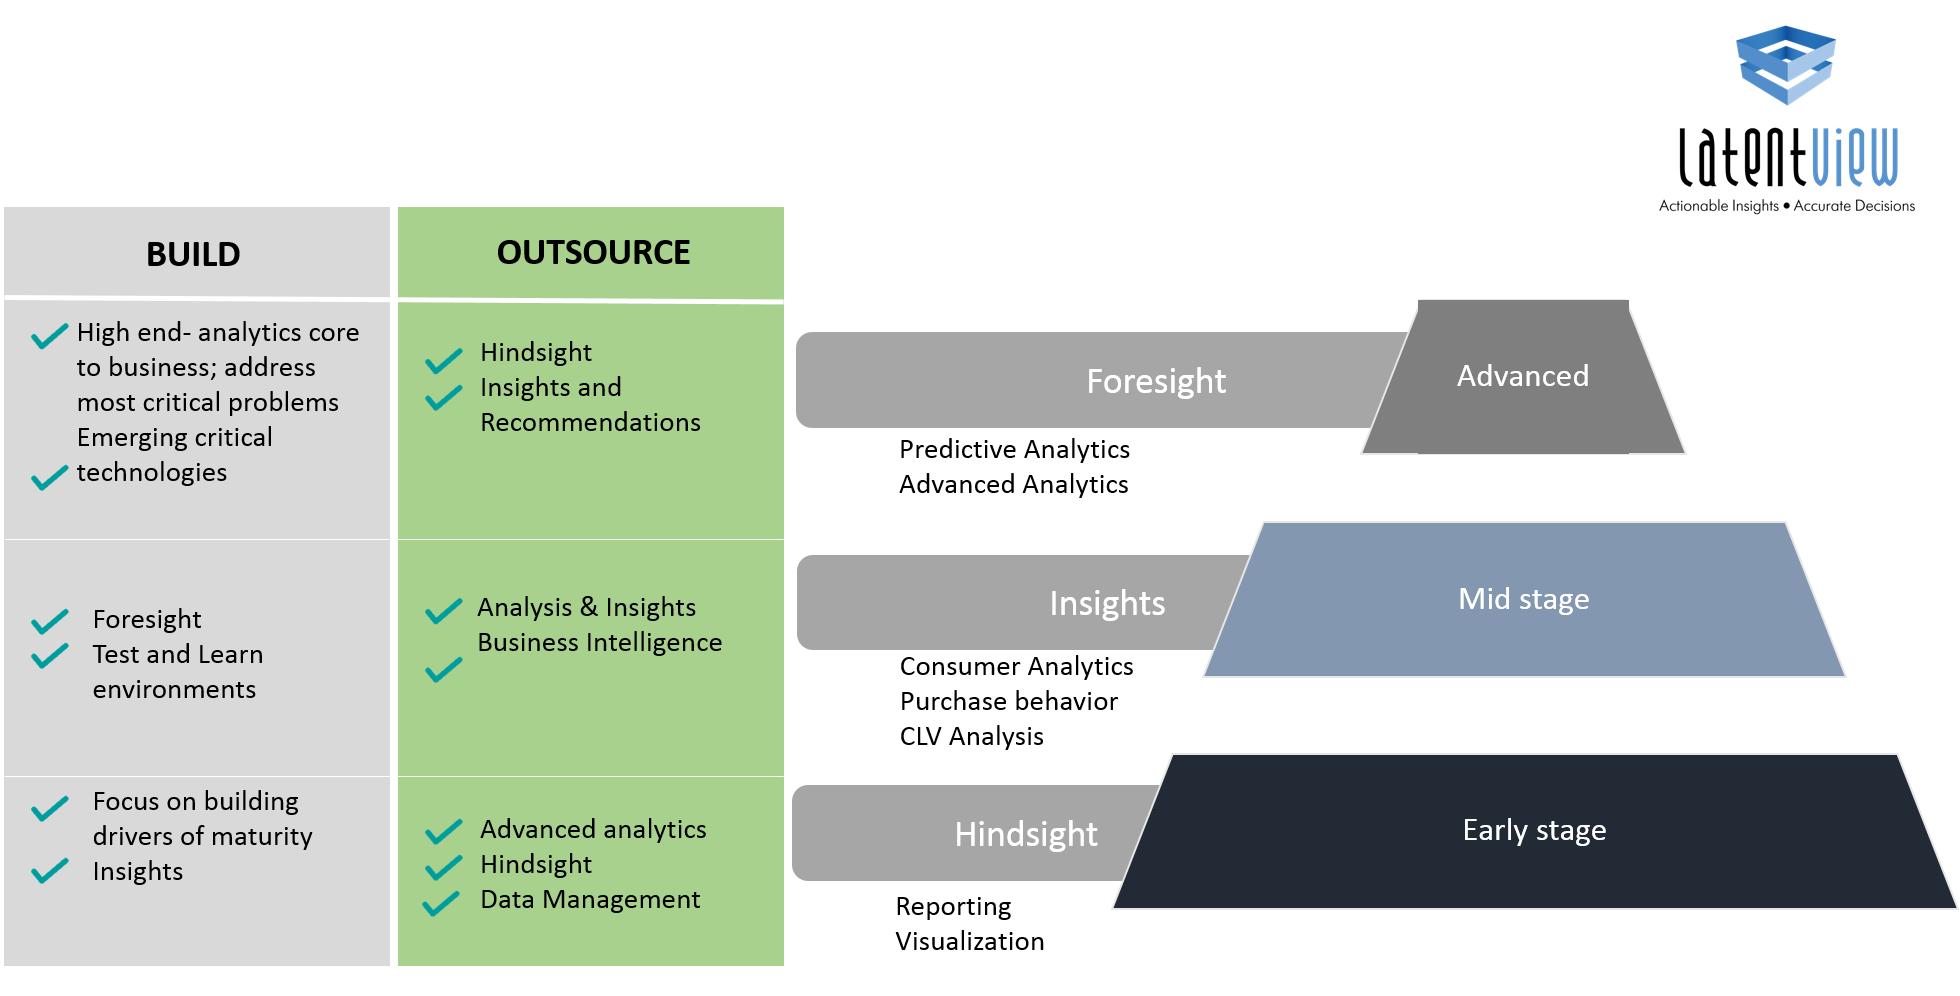
Figure 4: Mapping skills to analytics maturity
In the early stages, companies typically use data to get a ‘hindsight’ view. They need skills of reporting and visualization. They need to focus on building drivers of maturity – improving their data quality, increasing the analytics culture of their organization by demonstrating the benefit of using data in decision making. Depending on budgets, they can also look at building ‘insight’ capabilities. At this stage, they should look to outsource everything else – advanced analytics, data management as well as hindsight, to scale quicker.
>In the mid-stages, companies have the size and skills required to build on their ‘insights’ capabilities. They typically begin understanding purchasing behavior, conducting CLV analysis and advanced consumer analytics. This is also a good stage to begin experimenting with test and learn environments. Towards the latter part of this stage, companies typically begin doing some amount of advanced analytics and predictive modeling. Their focus should be to outsource reporting and data management and focus on building core advanced analytics capabilities
In the advanced stages, data analytics is now influencing strategy. At this stage, companies should focus on building in-house teams to do the advanced analytics work that is core to the business. They should also be evaluating emerging technologies that will have a significant impact on their business or industry. They should ideally be outsourcing other areas which can be more easily accomplished by partners while they invest their internal teams towards the strategic analytics initiatives.
We’re often asked by our customers what should be the ideal analytics structure – should it be centralized or decentralized?
Centralized model or the pooled resource model is great for efficiencies as the organization relies on a shared pool of resources to accomplish its analytics needs. Typically, early stage organizations use this structure to demonstrate success and when there is a lot of BI, survey and reporting work as there could be leverage in terms of reusable templates and pricing benefits on scale. However, the limitation of using this model is that while you can develop deep analytical expertise, the team lacks business context as they are shared across multiple teams.
With the decentralized model, there is a lot more context and insights generated as the analytics function is housed within the business units and is also responsible for the business goal.
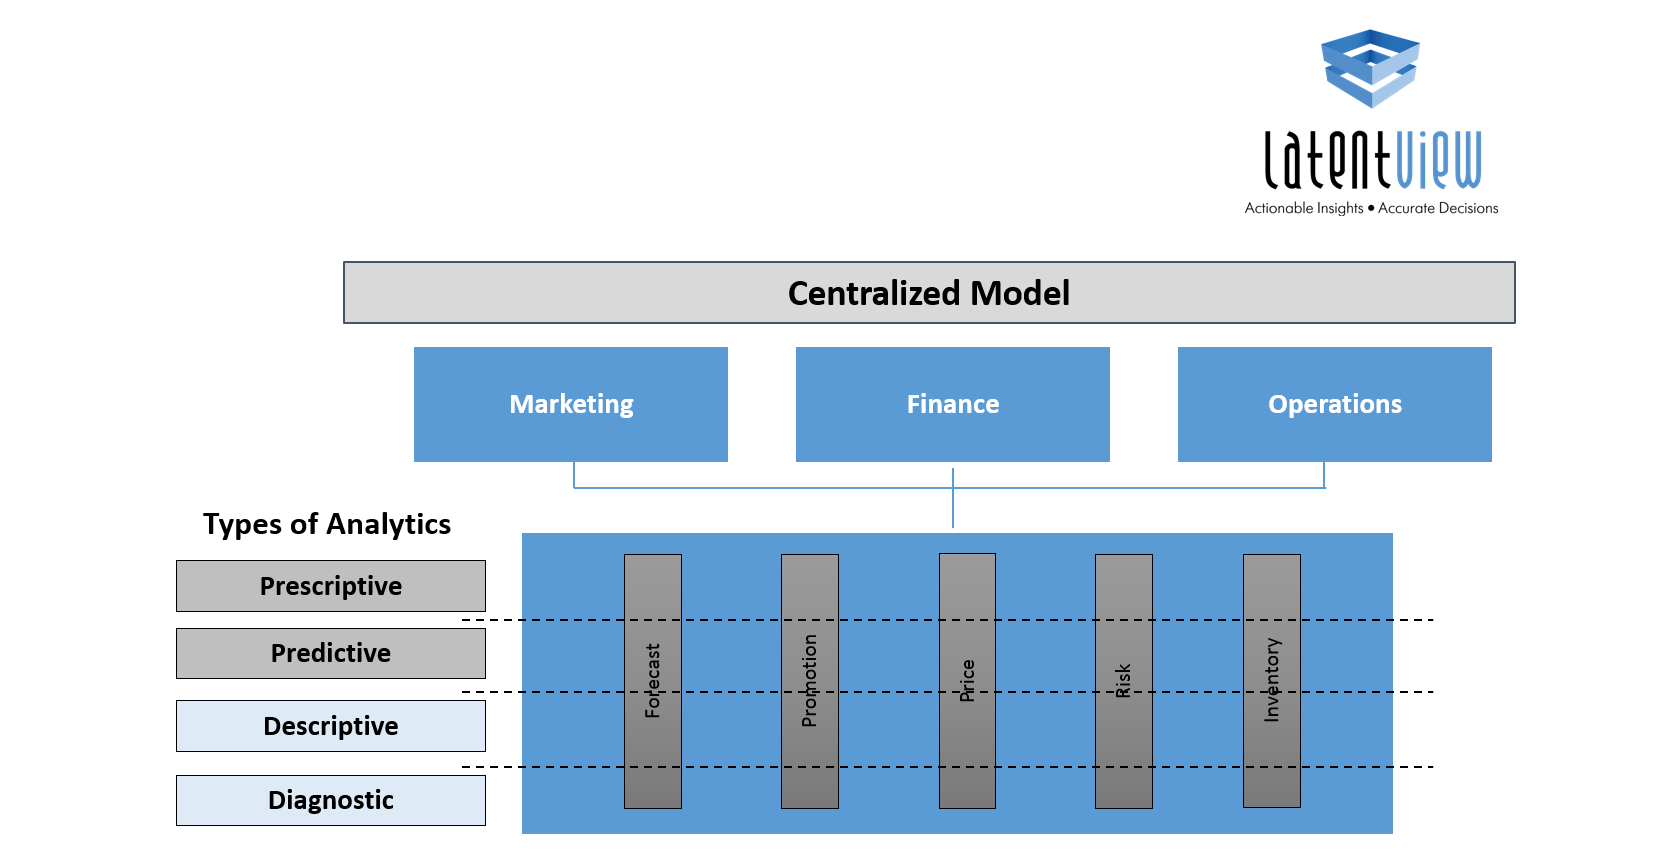
Figure 5: The hybrid analytics structure
However, the biggest limitation of this model is that the analytics teams being part of a business unit can be questioned on whether they can now evaluate the business unit performance objectively. Also, the analytics teams are often stuck in block and tackle mode and have little time for innovation. We typically see this structure in large organizations with complex hierarchies.
The ideal model is a mix of both which is a hybrid model which has the benefits of scale and efficiency that the centralized model provides, and the benefit of business context from the decentralized model as there is a loose coupling between sub-teams and business teams. As organizations mature, irrespective of whether they started with a centralized or decentralized model, they gravitate towards the hybrid model over time.
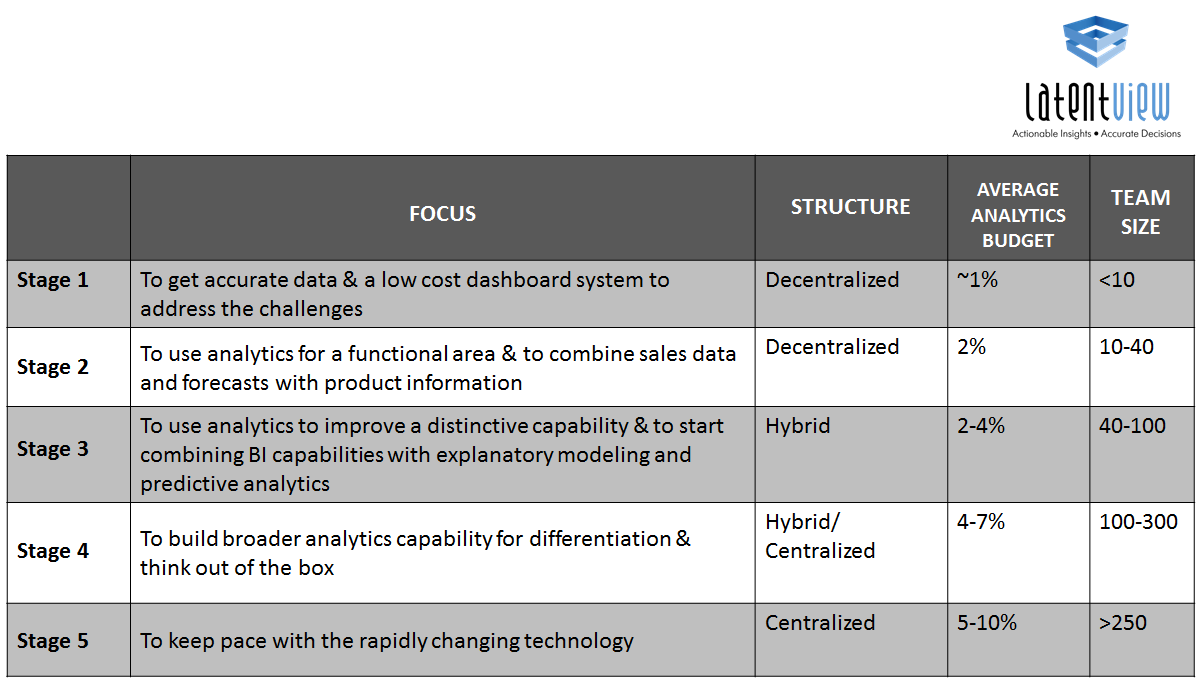
Figure 6: Mapping budget & team size with analytics maturity
Lastly, I would like to share typical team structures, sizes and budgets seen across organizations across the maturity life cycle. There is not one single path to optimal analytics maturity. However, the key is to identify where your organization fits across different levels, map the current maturity and identify the steps needed to go to the next level.
No comments:
Post a Comment