Saturday 25 February 2017

Using Analytics To Predict Movie Success At The Oscars

With the advent of Big Data and analytics, the world has changed in ways previously unimaginable. In a rapidly growing and thriving industry such as the motion picture industry, data analytics has opened a number of important new avenues that can be used to analyze past data, make creative marketing decisions, and accurately predict the fortunes of impending movie releases.
The timing of the movie release is critical to the success of a movie. To facilitate the release date selection, studios decide and pre-announce the targeted release dates on a weekly basis long before the actual release of their forthcoming movies. Their choices of release dates and then the subsequent changes are strategic in nature taking into consideration various factors like regional holidays, cultural events, political situation, sports events etc. Predictive analytics using the historical movie release data and their box office performance can help us identify the ideal release date of the movie to maximize performance at the box office.
Consider a scenario where a movie has already been slated for release on a particular date. Suddenly, a competitor movie is announced and the production house should decide whether it should go ahead with the release or make any changes.

Business Challenge:

Determining optimal release date for a movieleveraging analytics to enhance box office success rate for the movie.
‘Cats & Dogs’ and ‘America’s Sweethearts’ were scheduled to release on July 04, 2001. To avoid competition, ‘America’s Sweethearts’ was moved forward by a week to July 13, 2001 but soon a new entrant, ‘Legally Blonde’ was announced to be released on July 13, 2001. With a number of new players, what can be done to optimize release date for box-office success?

Approach

Social media analytics can be used to predict the optimal release date for a movie. Using data collected from social media channels, we can gauge expectations of the target audience and the buzz towards the movie.

Collection of Data

There are lot of macro and micro economic factors that affect the release date of a movie. Some of the factors that can be measured and factored during analysis are explained in the diagram below. Most of the data can be collected from public sources like IMDB, Rovi etc.
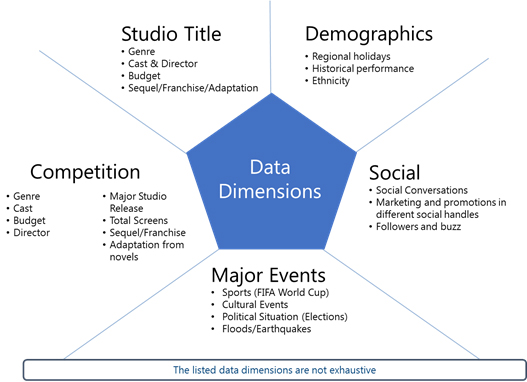
Using Analytics To Predict Movie Success At The Oscars
Studio Title
The database will contain historical data of all the movies at a studio and genre level including cast, support and box office performance.
CompetitionData of competitor movies (those getting released in the same week) needs to be analyzed carefully since other movie releases in the same genre will impact the performance of the movie at the box office.
Social Media Analysis
This process involves analyzing social media conversations along with the themes, sentiment and demographic features. This extracted data will help promote creatives that have the potential to create maximum impact and will also help identify the right target audience.
Major Events
Cultural events, sports events like the FIFA world cup, political events – elections, protests etc. also play an important role when it comes to the release of a movie. In these scenarios, it may not be ideal to release the movie during these events as theatre occupancy rates are generally lower.

Analysis:

Illustrative Scorecard
All factors considered, the ideal date on which America’s Sweethearts was to be released was decided in order to ensure higher probability of success.
A database with the release calendar provided information on competitors release, genre, budget etc. It is important to create a set of rules that satisfy the success criteria (which can be generated based on CART/ Decision Tree Rules Generation using historical data.)
Inferences:
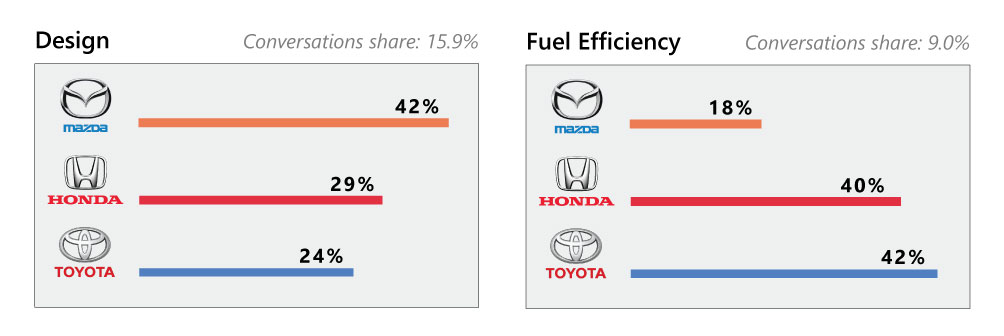
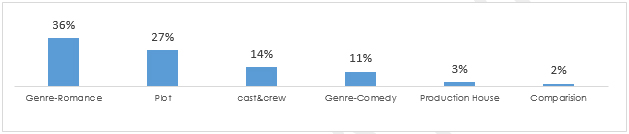
  • The data was collected from social media by using keywords relevant to the movie; thereafter, using text mining, top themes were extracted from the tweet data. Since the movie revolved around a love story, the most popular theme for the movie was the genre, which in this case was romance. The other significant genre which created a buzz in social media was comedy. Using this analysis, the most apt genre for the movie was decided, which was then used to market the movie.Inferences From Analysis
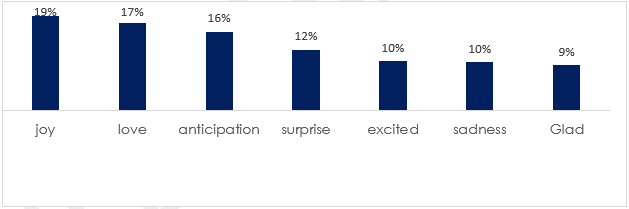
  • Using the same social media data, sentiment analysis was carried out. This gave the production house an idea of the public sentiment about the movie. The analysis showed ‘Joy’ as the top sentiment followed by ‘Love’Sentiment Analysis
  • We also saw the excitement about the movie release at different levels like, age, gender and location. This helped us identify the age group, gender and location where the movie gained maximum publicity, which will in turn helped with the marketing
    For e.g. Women in the age group of 21-24 dominated the social conversations while men in the age group of 26 to 32 had higher social engagement

Business Impact:

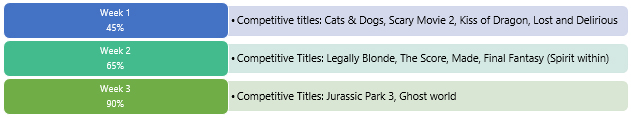
The inferences from social media data helped to select the final release date for the movie. Hence, instead of releasing the movie in the second week, it would have been better to release it in the third week since it had 25% more chances of success.
Business Impact
While winning an Oscar might be the ultimate taste of success, winning at the box office is as sweet a measurement of success. Though we cannot promise an Oscar, with analytics we can make sure of the latter!
Note: The engagement numbers and impressions mentioned are for representative purpose only.


*With inputs from Sathish Prabahar

Monday 13 February 2017

Steering Past the Big Data Black Hole

A recent Gartner survey found that 73% of companies have invested or will invest in Big Data in the next 24 months. But 60% of them will fail to go beyond the pilot stage. These companies will be unable to demonstrate business value.
At the same time, of those who have already invested, 33% have reached a stage where they have started to gain a competitive advantage from their Big Data. There is a huge chasm between deployment and demonstrating ROI and most companies are diving deep into it.
Much of the success of a Big Data strategy lies in the Data Architecture.
Its no longer adequate to collect data just for internal compliance. Data requirements are changing from pure procedural data (from ERP systems, say for example) to data for profit, the kind that can lead to significant business Insights.
This requires that things be done differently. To begin with, a Big Data Goal needs to be identified.
What does the organization hope to achieve from Big Data?
According to John D*, a senior data scientist at a Fortune 100 technology company, “companies are often tempted to ask questions just based on the data that’s available. Instead, they need to understand and frame their business strategy questions first—and then gather the data and perform the analysis that answers it.”
“Companies need to understand and frame the business strategy questions first—then gather the data and perform the analysis that answers it. It is often tempting to ask questions just based on the data that’s available”
The company he represents uses large scale datasets to understand its customers better, so as to delight them with their products and services.
‘Enhanced Customer Experience’ is the prime reason companies turn to Big Data Analytics. A study done by Gartner found it to be the Number 1 reason, followed by ‘Process Efficiency’.
summary
Both these require a blending of internal data with external sources. For enhanced consumer experience, for example, companies should be looking at geo-location data, transaction history, CRM data, credit scores, customer service logs and html data. For process efficiency, let’s say fraud detection for example, companies should be using transactional history, CRM data, credit scores, browsing history.
big-data
Once you start blending data sources, new challenges arise. First is the obvious challenge of increased amounts of data that needs to now be stored and cleaned. Second, a lot of the data is now unstructured and you need to be able to convert it into structured data, in order to analyze it and derive Insights. And because of the velocity of data being generated, you need to be able to do the conversion near real-time. Finally, we are no longer talking about just textual or numerical data but also videos.

Charting the IoT Opportunity

As the Internet of Things (IoT) gains momentum, it’s apparent that it will force change in nearly every industry, much like the Internet did. The trend will also cause a fundamental shift in consumer behavior and expectations, as did the Internet. And just like the Internet, the IoT is going to put a lot of companies out of business.
Despite these similarities, however, the IoT is really nothing like the Internet. It’s far more complex and challenging.

Lack of Standardization

Unlike the Internet, where the increased need for speed and memory was addressed as a by-product of the devices themselves, the sensors and devices connecting to the IoT network have, for the most part, in adequate processing or memory. Furthermore, no standard exists for communication and inter-operability between these millions of devices. Samsung, Intel, Dell andother hardware manufacturers have set up a consortium to address this issue. Another equally powerful consortium formed by Haier, Panasonic, Qualcomm and others aims to do the exactsame thing. This has raised concerns that each of these groups will engage in a battle to push their standard, resulting in no single solution.

New Communication Frontier

The Internet was designed for machine to human interactions. The IoT, on the other hand, is intended for machine-to-machine communications, which is very different in nature. The network must be able to support diverse equipment and sensors that are trying to connect simultaneously, and also manage the flow of large quantities of incredibly diverse data…all at very low costs. To meet these requirements, a completely new ecosystem —independent of the Internet— must evolve.

Data Privacy

The IoT also raises serious challenges for data security and privacy. Justified consumer concerns will call for stricter privacy standards and demand a greater role in determining what data they will share. These aren’t the only security issues likely to arise. In order for a complete IoT ecosystem to emerge, multiple players must use data from connected devices—but who owns the data? Is it the initial device that emits it, or the service provider that transports that information, or the company that uses it to provide the consumer better service offerings?

Geographic Challenges

For multinational organizations with data coming from various regions around the globe, things get even more complicated. Different countries have different data privacy laws. China and many parts of the EU, for example, will not let companies take data about their citizens out of their borders. This will result in the emergence of data lakes. To enable business decisions, companies must be able to access data within various geographies, run their analysis locally and disseminate the insights back to their headquarters…all in real-time and at low costs.

Tapping the IoT

In spite of all these challenges, the IoT is not something companies can afford to keep at arm’slength. Like the Internet, it will empower consumers with more data and insights than ever before, and they in turn will force companies to change the way they do business. From an analytics perspective, it’s very exciting. Companies will now have access to quality data that, if they combine it with other sources of information, can provide them with immense opportunities to stay relevant.
As an example, let’s look at the medical equipment industry. Typically these companies determine what equipment to sell based on parameters like number of beds and whether the facility is in a developing or developed market. However, these and other metrics are a poor substitute for evaluating need based on actual use. A small hospital in a developing country, for example, will diagnose and treat a much wider range of diseases than a similar facility in a more developed region. By equipping the machines with sensors, these manufacturers can obtain a better understanding of what is occurring within each facility and optimize selling decisions more effectively as a result.
This is just one example to underscore the tremendous potential that the IoT holds for businesses. In order to truly realize these and other opportunities, companies must understand the challenges outlined above and have a framework in place to address them. In the early days of the Internet, few could have predicted its transformative impact on all facets of our lives—personal and professional. As the IoT heads into its next phase of maturity, we can expect tosee a similar effect emerge

Marketing Mix Modelling: Challenges and Best Practices

The optimal allocation of funds across different channels of marketing is crucial for all organizations since investment decisions need to be made depending on the contribution each channel makes to the overall sales. Marketing Mix Modelling (MMM) helps quantify the contribution of various factors to sales and recommends fund allocation across multiple channels in order to achieve better ROI, efficiency and effectiveness. MMM is an analytical approach which is widely adopted across industries today to measure and optimize marketing budgets. While MMM has proved to be an effective technique to allocate funds more analytically, its implementation is key to achieve optimum results.
Key Challenges:
  1. The data needs to be understood thoroughly and delinked from mixed effects of any overlapping campaigns
  2. Validation of coefficients with borderline significance is important to maintain stability and consistency of new data before implementation
  3. Irregular market segments with thin and discrete history is a serious challenge for modelling and prediction. Such markets are dealt by ‘Proxy Modelling’ using higher levels of data and predictions, which are levelled by their proportional representation in the portfolio
  4. During implementation, the prediction and optimized allocation is made for all market segments by default without considering their real-time demands. If needed, depending on the marketing plans and priorities, budgeting and allocation has to be regulated as per the prevailing business or forecasting scenarios
  5. Thin market segments with irregular history may not appropriately fit for building ‘S curves’ to reflect the sensitive cost-revenue relationship; such market segments can be predicted by grouping them based on business considerations
Best Practices
  1. For superior insights, the objectives of MMM and what it plans to achieve should be clearly set by:
    1. Identifying drivers of revenue and quantifying impact
    2. Optimizing spend across different marketing channels for maximum return
    3. Time-series forecasting for future plan of action
  2. Every touchpoint in the customer journey should be defined, tracked and measured for proper accounting of cost and revenue components by marketing levels such as geography, channel etc.
  3. Revenue regressed on cost or raw variables (clicks, impressions) by channel should be accounted and available at the same granular level (either through derivation or already set up by the company.)  Data should be set at the same level – especially the cost variables since they are available at higher levels and have to be broken down to the lowest granular level on which the model is built
  4. It’s important to check key variables for both statistical and business significance
  5. Building an ‘S curve’ (sigmoid shape) to plot the growth rate of revenue as a function of cost in percentile scaling will help determine the ‘Spend Limits.’ Fitting of ‘S Curves’ to data should be done by tuning the shape, scale parameters of a chosen distributional form with respect to the empirical distribution of cost and revenue
  6. ‘Optimal Point’ should be discovered where revenue growth rate is maximized for a given cost
  7. Cost allocation by the channels that maximize the overall revenue should be optimized
  8. Test and control markets should be compared and then the feedback can be used to refine the model performance
Common Mistakes:
  1. To prevent incorrect results, disproportionate values and volatile distribution of data should be checked, trimmed and transformed
  2. Missing data should be dealt with before modelling, else it could lead to inefficient results
  3. Do not choose incorrect transformation for data in order to ensure the linearity and stability of the variables
  4. To avoid wrong attribution to marketing promotions, time-series data should be converted into a cross-sectional form before building the models by accounting and adjusting for seasonality and auto correlations in the data. If needed, models should be built on de-seasonalized and stationary data
  5. Data must be aggregated and summarized at requisite time intervals to correct the data imbalance like missing revenue to a cost point or vice-versa
  6. Spend limits are acceptable up to the saturation point in an ‘S curve.’ Promotional costs should be planned in a range between the discovered minimum and saturation points to avoid losses. Similarly, a minimum spend threshold should be maintained for stable markets
Since the stakes are high for brand building, following the best practices while implementing the model and taking care of the challenges that come along the way can provide high ROI and improve marketing decisions extensively. An MMM model can provide a consistent and more accurate set of metrics, which will help marketers influence the overall consumer journey.

Friday 27 January 2017

5 Data Analytics Trends That Will Make Waves in 2014

What trends should data analysts be paying attention to this year? From mobile and cloud to visualization and the Internet of things, Venkat Viswanathan, Founder and Chairman at LatentView gives TDWI his list of the five most important movements to watch.
Now that we’re in the swing of a new year, we’ve taken stock of the data analytics trends that are brewing and developed a list of the Top 5 trends we believe are going to dominate the industry this year. Even if some of them don’t realize their full potential in 2014, it promises to be an important year in which consumer trends and technology innovation will further shape a future in which companies make data-driven decisions.
analytics-trends
1. Data Visualization Goes Mainstream
In the mid-90s, e-mail introduced the Internet to consumers, made it more accessible, and catalyzed user adoption. Similarly, data visualization will make data analytics more accessible in 2014. Visual analytics allows business users to ask interactive questions of their prepared data sets and get immediate visual responses, which makes the whole process engaging.

How To Extract The Maximum From Your Digital Panels

In order to provide accurate digital insights that are representative of the browsing population across devices, companies are increasingly looking to collect consumer behavior data from multiple sources. They then look to blend those sources into a single digital panel, and use algorithms and advanced analytics techniques to normalize the data to the population as a whole.
Digital panels track every click of the panel member, search key words and can help understand path to purchase better (either in their digital property or at competitors property). Once the raw digital behavioral data in the panel is collected, it is sent to analytics firms like LatentView. We break the semi-structured data like search results pages, log files, social messages, and email messages into structured data that is queryable. Once the data is migrated into structured data, the data can be analyzed for past user behavior (hindsight), current user behavior (insight) and future user behavior (foresight). This will help in building new digital processes, improving existing processes and increasing traffic to sales conversion ratio.
Extract-maximum-from-Digital-panel
CASE STUDY: Competitor analysis on clickstream data:
A leading search engine provider wanted us to help them find out what path was taken by users before going to their purchase website (how much time they spent researching the product, reading reviews about the product, time spent in each category vis-à-vis, the time spent on a competitors website).
LatentView built an innovative, automated and standardized framework to analyze clickstream logs and mine insights around user positioning in the purchase funnel. This framework programmatically sorted clickstream pages into different categories using an ensemble of predictive modeling methods on high-end EC2 machines.
Post categorization of the pages, we conducted an analysis to study the position of the user in the purchase funnel (customer decision journey) for each session. This was identified based on browsing activity, activity duration, age of the member and time of day. We then identified key signals that would aid the ad and result in customization. These insights were used by their planning team in their efforts to make relevant changes to their website. All paths from clickstream can be broadly categorized into awareness, research, evaluation and purchase website (company’s site or competitor’s site).
purchase-cycle
Here were some of the insights we helped our client with:
• The clothing and shoes category had a very high probability of users purchasing online and the purchase behavior was strongly supported by price and product comparison in search engines.
• Search engines followed by intra-site searches fuel users towards purchase.
• Emails can be an effective medium for promoting clothes and shoes.
• Also, most users who visited their competitor’s purchase link end up going back to their search engine or another shopping page; click-thru to actual merchant is low.
Combining the above analysis with user behavior and based on the path used, we were able be able to predict the probability for purchase at the end of session.
time-spent
We also performed a Financial Services Monetization analysis for the same company. The objective of the analysis was to understand what users do after searching for a stock query and how they can monetize the same. On analyzing the clickstream data, we found that the two most common actions after a stock query was to visit stock financial advisory sites and the brokerage sites. The current answer block already addresses the research intent. So to address the purchase intent, which is evident through visits to brokerage sites, we recommended showing brokerage ads and adding a buy/sell button as two options. The client’s engineering wing decided to flight both these features in the following weeks based on our recommendation.
financial-services-monetization
As we move into the cross-platform and digital world, delivery of accurate, stable and accredited data takes on increasing importance. To get there, we will continue to need a valid, representative, consistent and comprehensive view of audiences, which is why high quality panels continue to be of primary importance.
In case you have a digital property and would like to know the comparison of user experience between your competitors website tor mobile app and your website or app, please contact us at: sales@latentview.com
With inputs form Vyshnavi Eluri.

http://www.latentview.com/blog/extracting-insights-digital-panels/ 

Mastering the “Three C’s” of Mobile Retail Success

Modern Marketer’s fascination with mobile is not new – the power of this channel has been measured, analyzed and talked about for quite some time now, and the focus is certainly not going away. The value of this channel as a business tool is undeniable. According to Gartner, by year-end 2016, more than $2 billion in online shopping will come from mobile digital assistants.
The next frontier for success in this arena is learning how to better personalize the mobile experience. I expect that in the coming months and years we’ll see businesses put an increased focus on making mobile personal. To achieve this, marketers must focus on delivering the “three C’s” of mobile success: Convenience, Customization, and Commerce. In a nutshell, they need to make it easy, make it personal, and make buying simple.
Analytics plays an important role for marketers as they work to achieve this goal. Mobile devices have a prominent place in the expanding Internet of Things (IoT) ecosystem, and businesses should be leveraging analytics to collect the rich data they provide. Once consumers have agreed to “opt in,” retailers can learn quite a bit from how they use their devices to interact with a brand. For example, what products are they most interested in browsing and buying? How often are purchases made and are there developing patterns? If a shopper is buying the same box of baby diapers once every two weeks, for example, they might appreciate a reminder to buy, notifications of sales or an automated purchase renewal option. Analytics give retailers the power to identify these patterns and adjust their offerings to better cater to users, in turn enhancing the convenience, customization and commerce of mobile shopping.
Retailers also track in-store journey of the consumers using mobile apps. Hillshire brands uses iBeacons to track shoppers’ journey through the aisles of a grocery store and sends customized discount coupons or ads for their craft sausages when the shopper approaches that section of the store.
Beyond customized offerings, retailers armed with data science tools can achieve other business benefits such as leaner operations and better control over enterprise-wide assets by taking advantage of predictive analytics capabilities to determine inventory, assortment and pricing models. Walmart is one such retailer which has updated its mobile app with search my store feature. The application allows in-store shoppers to search using keywords and product names, to find the real-time inventory, pricing and the accurate in-store location. This gives the shoppers a digitally enhanced experience.
Consumers also tend to use their phones to tap into and contribute to social channels, another gold mine of consumer data. Social channels are a great source for consumer information because, generally speaking, users are there to interact with their friends and are more likely to share true opinions, experiences and feedback about products or brands. With the aid of advanced social analytics tools, retailers can tap into these networks to gauge feedback and sentiment to improve shopping experiences, on mobile devices and otherwise.
The mobile commerce journey is changing. People are managing an increasing percentage of their lives on mobile devices, and mobile commerce is getting a growing share of the ecommerce pie. Mobile certainly presents challenges for retailers – delivering a superior experience while dealing with a small user interface, short consumer attention span and myriad other hurdles is no easy feat. But, with the power of social and digital analytics at their side, the growth of this channel also presents opportunities. Retailers who win the mobile game going forward will be those that tap powerful analytic tools to truly achieve the critical “three C’s” of mobile success.

Understanding the “decision funnel” using unstructured data

Businesses are well aware that analytics are changing everything—and that the difference between simply surviving, or thriving, hinges in how they interpret and utilize data. Through analytics, organizations gain insights that drive decision making about everything from marketing and customer support to accelerating product innovation. However, often, the data that holds the greatest business value, unstructured data, is going untapped.
Unstructured data comes from many channels and sources, both conventional and emerging. Conventional data sources often include: survey data, web browsing data, product purchase data and focus groups. Emerging sources can include: social media data, connected devices/wearables, mobile data, customer service/customer experience data.
Combining the information from all of these sources gives a company a critical view into how customers perceive its brand and how the business is stacking up against the competition. In fact, applying a custom analytics model to unstructured data, literally millions of data points, can reveal deep insight into what drives customers’ purchasing decisions. The average customer commonly moves through a process that’s described as the “purchase decision funnel.”
There are six stages in this funnel, broken down as follows:
Upper funnel:
  • Brand awareness: share of voice (SOV) compared to competitors
  • Brand perception: how closely a brand is associated with key features for an offering (i.e., performance, reliability, cost, etc.)
  • Digital engagement: how effectively a brand engages with potential customers across the digital channels of web, app, social media & YouTube.
Lower funnel:
  • Brand consideration: how frequently is a brand present in multiple brand conversations
  • Buying experience: how satisfied is the customer at the time of purchase versus competitor brands
  • Owner engagement: post-purchase customer advocacy
Intelligence gathered from unstructured data analytics can help brands adapt their business to address gaps in these critical areas. For instance, a brand can invest resources into improving its online SOV to influence consumers at the upper part of the decision funnel, or it can invest more in the customer experience process after a purchase to create greater loyalty and drive engagement at the lower end.
lv_graph1
The influence that higher SOV can bring to a brand is at times a double edged sword.
Consider the case of Toyota & Honda compact SUVs (Rav4 & CRV), where Toyota RAV4 had a three times higher SOV compared to Honda CRV in 2015, yet were roughly equal in terms of a sales volume. Toyota RAV4 was plagued by the seat belt recall issue which dominated the social conversations and potentially impacted the customer purchase decisions.
Similarly, Mazda is popular for its comfort and design among consumers and is very also fuel efficient as per internal tests data; however, consumer perception does not reflect this. Mazda’s service sentiment is also low and service levels has been on decline between 2010 to 2015. So possible campaigns need to focus on this message. Improving this could further enhance the number of Mazda brand advocates.
lv_graph2
In the one year SOV comparison between Honda CRV, Mazda CX5 & Toyota RAV4, Honda despite having three times lower share of voice than Toyota RAV4 exceeded the sales possibly due to the positivity in the conversations.  Hence, for the upper funnel it was observed that Honda has strong associations with key features like performance and comfort and Mazda has weak associations in the consumer’s mind with different features. It was also observed that Mazda is lagging in the digital consumer experience.
lv_graph3
For the lower funnel it was observed that Mazda appears less frequently in the brand consideration set. While Mazda was rated high when it came to sales satisfaction, it scored low in prospect satisfaction suggesting potential lapses in prospective customer treatment at the dealerships. Now that the indices can be obtained at a dealership level, the data could also be analyzed further to identify dealerships that need improvement and dealerships that are performing well; this will enable cross learning opportunities. Further, specific measures like product genius as adopted by Apple retail can be put to test in select dealerships and the improvement can be monitored using these indices.
The decision funnel can reveal insights into the brand perception analysis to help senior management compare expected and actual perception for their brands and fine tune messaging to enhance and modify perception as needed. Consider the case of streaming services player Netflix, considered a giant in media content. Netflix had recently lost some of its lead in shows to online streaming competitor Hulu. Prompt awareness of this change in perception using analytics to understand the change in perception would allow Netflix to make strategic decisions to rechart consumer perceptions about their shows and develop marketing campaigns or content appropriately. The analysis will also serve to continuously monitor the success of these strategic moves.
Take another example; in the case of Mazda, the service sentiment is low and service levels has been on decline between 2010 to 2015. Improving this could further enhance the number of Mazda brand advocates. Further Nissan has shown significant improvement in overall customer retention after it gained a set of loyal customers for it’s niche electric car – Nissan Leaf aided by the IHS loyalty automotive awards. The decision funnel can reveal where and why, what is lacking in your brand.
lv_graph4
If you are seeking to strengthen your brand, gain competitive advantage and boost sales and revenues, analyzing unstructured data to better understand and impact the decision funnel may be the perfect foundation for this transformation.

Thursday 19 January 2017

Determining Perception Gap Through Twitter

Being an analytics professional, I like doing interesting analyses on various hypotheses I have regarding what is going on in the world. Most recently, I’ve been thinking about how there is a mismatch between what the businesses portray and what the consumers actually feel about brands.
To test this hypothesis, I analyzed 100,000 tweets of four brands: Sears, Wal-mart, Kroger and Macy’s. And the findings are in line with the hypothesis. Consumers have a very specific impression of each brand which is the sum total of all the marketing efforts and in-store experiences e.g. we can see below in the first chart that Sears has a very distinct impression compared to other retailers. One surprising thing that I found in the analysis is that there is very little buzz around celebrity associations despite the massive marketing dollars which are poured into it.
No doubt, social media has become an integral part of marketing divisions but its real power– to determine consumer sentiment – is still grossly underutilised. In today’s highly competitive marketplace, businesses need to be extra attentive to what consumers are saying and what better a place to learn that other than social media, to which consumers pour their hearts out 24 hours a day in their highly connected lives through smartphones, tablets and desktops.
Infographic on determining perception gap through Twitter & Social Media
Determining Perception Gap Through Twitter – Comparison of Sears, Walmart, Macys & Kroger

What Is Your Organization’s “Age” Of Analytics Maturity?

In this first post of a brief blog series, we’ll take a broad view at how organizations, such as your own, can assess analytics maturity and what they can do to move up the maturity curve faster (and ultimately, apply analytics to do everything from drive operational efficiencies, expedite product innovation and enhance consumer experience, to boost financial performance).
Lots of organizations use analytics in some form today across their operations, but there are still too many who are lagging behind. Others, those who exhibit analytical aspirations, are interested in adopting analytics to drive business strategy, but haven’t taken proper action. There are still more who have built a platform for execution, but are either hitting wall on next steps, or simply need to evolve. Of course, there are the rare few who have reached the highest level of analytics maturity – and are successfully aligning analytics to business goals to achieve desired results.
What Is Your Organization's "Age" Of Analytics Maturity?

Where does your organization stand?
To truly answer that question, you must know where you fall within the five stages of analytics maturity – an evolution that starts with infancy, or the analytical novice, and moves through to a stage of development where organizations are executing an analytics-driven business strategy each day. To help organizations gauge this, and see what the “levels” look like from a practical business perspective, we recently developed the Analytics Maturity Self-Assessment. It’s a tool that provides organizations with actionable information to assess strengths and weaknesses across the critical analytics success factors—data, analytics processes and practices, and culture—and to provide guidance on advancing to the next stage.
Here are the first two stages on the maturity scale which are addressed in the self-assessment. Does this sounds familiar to you? If not, that may mean that your organization has taken more of an evolutionary “analytics” leap than you thought. 
Stage 1: Analytical Novice
This is the base level of the scale. Companies in Stage 1 may be lagging behind in adopting an analytics strategy to drive business decisions, potentially eroding their competitive edge. The development of a sound data management strategy has not begun yet or is in its infancy, and data quality and consistency may be poor. Analytics is driven mainly by the use of spreadsheets, and business leaders need to gain a better understanding about the value of analytics.
One hint for advancing to the next stage: By setting up a discovery phase to identify use cases for data-driven decision-making, you can select a business goal (marketing campaign effectiveness or supply chain demand forecasting, for instance) that can benefit from comprehensive data analysis.
Stage 2: Exhibits Analytical Aspiration
In Stage 2, progress has been made and it is evident that the organization has an interest in adopting analytics to drive business strategy has been developed, but these interests still need to be augmented with action. The organization has identified its need for data infrastructure, but the strategy team is not participating in discussions about analytics usage. In this stage, business leaders are curious about using analytics, but they have not established a clear vision of how to continue.
One hint for advancing to the next stage: Kick off analytics training programs across business groups to familiarize and retrain team members and encourage them to participate in crowdsourcing competitions. Get your teams excited to use analytics!
We realize that this just scratches the surface; therefore, we encourage you to reach out with questions, and we’re happy to delve further into either of these areas.
We can’t emphasize enough that no matter your market sector, a sophisticated analytics operation doesn’t happen overnight. It requires the right mix of ingredients—technology, culture and data—to come together in an effective way. In fact, over a two-year timeframe, LatentView’s research has shown that companies with a culture that encourages practices that enable the effective use of analytics progress the furthest toward analytics maturity. We’ll address this more in coming posts.
Be sure to keep a look out for insights on steps 3 through 5! But, if you can’t wait to see where you stand, click here to complete the assessment now.

Mastering Customer Retention Using Data

In the halls of marketing fame, customer acquisition stories get all the attention while those involving retention are rarely discussed with the same fervor and enthusiasm. Yet, most marketers will admit in private that customer retention is the single most important priority and an integral part of their strategy, which significantly impacts their bottom line. According to global consulting firm Bain & Company, it costs six to seven times more for an organization to acquire a new customer than to keep an existing one.
Increasing customer retention and loyalty is particularly relevant for retailers as they attempt to grab market share in a competitive environment. But how exactly can retailers identify and create loyal customers? Mere numbers — visits to a website, for example — do not tell us the full story of brand affinity unless they are also accompanied by other critical indicators regarding attitude or perception, and sentiment or advocacy toward the brand.
In creating a loyal customer, retailers need to first segment their customers based on their specific phase in the retention cycle. During each phase, data analytics can aid and support their outreach and marketing efforts.
blog-bad-cust-exp
When it comes to acquiring a new customer, retailers typically use a variety of channels to draw customers into their stores. These include advertising, promotions, affiliate programs, referral programs, coupons, rewards and other incentives. By effectively leveraging data analytics during this phase, retailers can ensure that these efforts are more than just random attempts at attracting customers.
How exactly can data help? Some of the ways analytics can be leveraged include better attribution insights or clues into what leads prospective customers into their stores. By identifying and gaining insights on better understanding the motivation of potential high value customers, retailers can redesign their promotions and product mix to attract such customers.
There are several ways in which a combination of internal and external data from CRM systems, transactional reports and demographic databases can be pieced together to get a better picture of what drives a customer to consider a purchase. When such information is combined with geographical data gleaned from mobile devices, it gives retailers a location-based map of customer sentiment and inclination. This can help them target customers with timely promotions and updates. For example, a customer could get a notification about a special discount on running apparel in a sporting goods store as soon as they step into a mall where that store is located.
Retailers often believe once a customer enters a store, online or brick and mortar, and make a purchase, they are a potentially loyal customer. They are entered into a database and the retailer begins treating this group (customers who have made a purchase) as a homogenous entity, running campaigns and offers to convert them to “loyal customers.” But they often do not meet with much success and have a very low conversion rate. The reason for this is customers all have different stages of brand involvement. To begin with, it takes a certain number of transactions before a customer and their purchases can be classified as intentional and not merely impulsive. What that number is changes from business to business, but a look at historical data can very quickly help define that threshold.
It is within this customer set, the ones that have reached the purchasing threshold, that you begin looking for “loyal customers.” Analytics can help create models based on historical data as well as external data, like wealth credit scores to predict high net worth customers, or common patterns of behavior, sometimes referred to as DNA markers. Customized campaigns directed at this segment will have greater success and higher conversions.
Ultimately, customer experience and satisfaction holds the key to driving repeat purchases. This is certainly more important in some sectors versus others. In the travel and hospitality sectors for example, positive customer experiences are essential for repeat transactions, while negative experiences could stifle this portion of business completely. Again, retailers can turn to data analytics in order to isolate bottlenecks and constraints that result in poor customer service or — in the case of an online business — cause customers to abandon their purchases.
As is clear from all of this, customer retention is a critical process that requires an understanding of where a customer or prospect fits in the retention cycle. With this understanding in place, data analytics can come in to help marketers cultivate the quality they most value in their customers — loyalty.