Friday 27 January 2017

5 Data Analytics Trends That Will Make Waves in 2014

What trends should data analysts be paying attention to this year? From mobile and cloud to visualization and the Internet of things, Venkat Viswanathan, Founder and Chairman at LatentView gives TDWI his list of the five most important movements to watch.
Now that we’re in the swing of a new year, we’ve taken stock of the data analytics trends that are brewing and developed a list of the Top 5 trends we believe are going to dominate the industry this year. Even if some of them don’t realize their full potential in 2014, it promises to be an important year in which consumer trends and technology innovation will further shape a future in which companies make data-driven decisions.
analytics-trends
1. Data Visualization Goes Mainstream
In the mid-90s, e-mail introduced the Internet to consumers, made it more accessible, and catalyzed user adoption. Similarly, data visualization will make data analytics more accessible in 2014. Visual analytics allows business users to ask interactive questions of their prepared data sets and get immediate visual responses, which makes the whole process engaging.

How To Extract The Maximum From Your Digital Panels

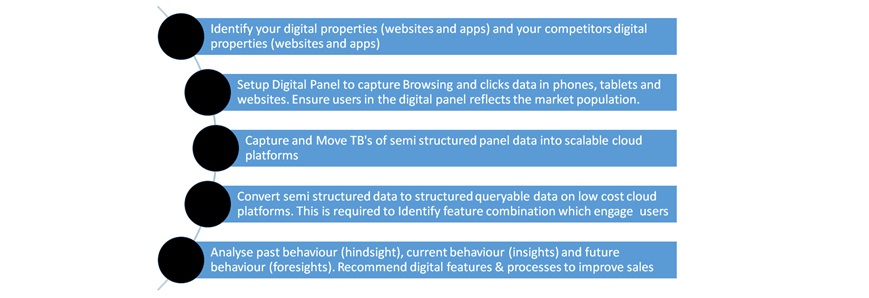
In order to provide accurate digital insights that are representative of the browsing population across devices, companies are increasingly looking to collect consumer behavior data from multiple sources. They then look to blend those sources into a single digital panel, and use algorithms and advanced analytics techniques to normalize the data to the population as a whole.
Digital panels track every click of the panel member, search key words and can help understand path to purchase better (either in their digital property or at competitors property). Once the raw digital behavioral data in the panel is collected, it is sent to analytics firms like LatentView. We break the semi-structured data like search results pages, log files, social messages, and email messages into structured data that is queryable. Once the data is migrated into structured data, the data can be analyzed for past user behavior (hindsight), current user behavior (insight) and future user behavior (foresight). This will help in building new digital processes, improving existing processes and increasing traffic to sales conversion ratio.
Extract-maximum-from-Digital-panel
CASE STUDY: Competitor analysis on clickstream data:
A leading search engine provider wanted us to help them find out what path was taken by users before going to their purchase website (how much time they spent researching the product, reading reviews about the product, time spent in each category vis-à-vis, the time spent on a competitors website).
LatentView built an innovative, automated and standardized framework to analyze clickstream logs and mine insights around user positioning in the purchase funnel. This framework programmatically sorted clickstream pages into different categories using an ensemble of predictive modeling methods on high-end EC2 machines.
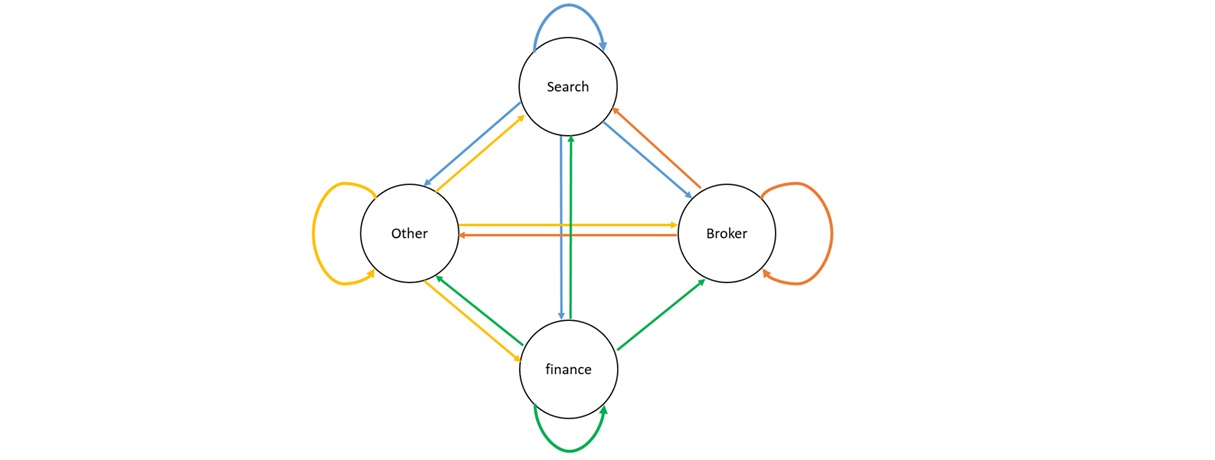
Post categorization of the pages, we conducted an analysis to study the position of the user in the purchase funnel (customer decision journey) for each session. This was identified based on browsing activity, activity duration, age of the member and time of day. We then identified key signals that would aid the ad and result in customization. These insights were used by their planning team in their efforts to make relevant changes to their website. All paths from clickstream can be broadly categorized into awareness, research, evaluation and purchase website (company’s site or competitor’s site).
purchase-cycle
Here were some of the insights we helped our client with:
• The clothing and shoes category had a very high probability of users purchasing online and the purchase behavior was strongly supported by price and product comparison in search engines.
• Search engines followed by intra-site searches fuel users towards purchase.
• Emails can be an effective medium for promoting clothes and shoes.
• Also, most users who visited their competitor’s purchase link end up going back to their search engine or another shopping page; click-thru to actual merchant is low.
Combining the above analysis with user behavior and based on the path used, we were able be able to predict the probability for purchase at the end of session.
time-spent
We also performed a Financial Services Monetization analysis for the same company. The objective of the analysis was to understand what users do after searching for a stock query and how they can monetize the same. On analyzing the clickstream data, we found that the two most common actions after a stock query was to visit stock financial advisory sites and the brokerage sites. The current answer block already addresses the research intent. So to address the purchase intent, which is evident through visits to brokerage sites, we recommended showing brokerage ads and adding a buy/sell button as two options. The client’s engineering wing decided to flight both these features in the following weeks based on our recommendation.
financial-services-monetization
As we move into the cross-platform and digital world, delivery of accurate, stable and accredited data takes on increasing importance. To get there, we will continue to need a valid, representative, consistent and comprehensive view of audiences, which is why high quality panels continue to be of primary importance.
In case you have a digital property and would like to know the comparison of user experience between your competitors website tor mobile app and your website or app, please contact us at: sales@latentview.com
With inputs form Vyshnavi Eluri.

http://www.latentview.com/blog/extracting-insights-digital-panels/ 

Mastering the “Three C’s” of Mobile Retail Success

Modern Marketer’s fascination with mobile is not new – the power of this channel has been measured, analyzed and talked about for quite some time now, and the focus is certainly not going away. The value of this channel as a business tool is undeniable. According to Gartner, by year-end 2016, more than $2 billion in online shopping will come from mobile digital assistants.
The next frontier for success in this arena is learning how to better personalize the mobile experience. I expect that in the coming months and years we’ll see businesses put an increased focus on making mobile personal. To achieve this, marketers must focus on delivering the “three C’s” of mobile success: Convenience, Customization, and Commerce. In a nutshell, they need to make it easy, make it personal, and make buying simple.
Analytics plays an important role for marketers as they work to achieve this goal. Mobile devices have a prominent place in the expanding Internet of Things (IoT) ecosystem, and businesses should be leveraging analytics to collect the rich data they provide. Once consumers have agreed to “opt in,” retailers can learn quite a bit from how they use their devices to interact with a brand. For example, what products are they most interested in browsing and buying? How often are purchases made and are there developing patterns? If a shopper is buying the same box of baby diapers once every two weeks, for example, they might appreciate a reminder to buy, notifications of sales or an automated purchase renewal option. Analytics give retailers the power to identify these patterns and adjust their offerings to better cater to users, in turn enhancing the convenience, customization and commerce of mobile shopping.
Retailers also track in-store journey of the consumers using mobile apps. Hillshire brands uses iBeacons to track shoppers’ journey through the aisles of a grocery store and sends customized discount coupons or ads for their craft sausages when the shopper approaches that section of the store.
Beyond customized offerings, retailers armed with data science tools can achieve other business benefits such as leaner operations and better control over enterprise-wide assets by taking advantage of predictive analytics capabilities to determine inventory, assortment and pricing models. Walmart is one such retailer which has updated its mobile app with search my store feature. The application allows in-store shoppers to search using keywords and product names, to find the real-time inventory, pricing and the accurate in-store location. This gives the shoppers a digitally enhanced experience.
Consumers also tend to use their phones to tap into and contribute to social channels, another gold mine of consumer data. Social channels are a great source for consumer information because, generally speaking, users are there to interact with their friends and are more likely to share true opinions, experiences and feedback about products or brands. With the aid of advanced social analytics tools, retailers can tap into these networks to gauge feedback and sentiment to improve shopping experiences, on mobile devices and otherwise.
The mobile commerce journey is changing. People are managing an increasing percentage of their lives on mobile devices, and mobile commerce is getting a growing share of the ecommerce pie. Mobile certainly presents challenges for retailers – delivering a superior experience while dealing with a small user interface, short consumer attention span and myriad other hurdles is no easy feat. But, with the power of social and digital analytics at their side, the growth of this channel also presents opportunities. Retailers who win the mobile game going forward will be those that tap powerful analytic tools to truly achieve the critical “three C’s” of mobile success.

Understanding the “decision funnel” using unstructured data

Businesses are well aware that analytics are changing everything—and that the difference between simply surviving, or thriving, hinges in how they interpret and utilize data. Through analytics, organizations gain insights that drive decision making about everything from marketing and customer support to accelerating product innovation. However, often, the data that holds the greatest business value, unstructured data, is going untapped.
Unstructured data comes from many channels and sources, both conventional and emerging. Conventional data sources often include: survey data, web browsing data, product purchase data and focus groups. Emerging sources can include: social media data, connected devices/wearables, mobile data, customer service/customer experience data.
Combining the information from all of these sources gives a company a critical view into how customers perceive its brand and how the business is stacking up against the competition. In fact, applying a custom analytics model to unstructured data, literally millions of data points, can reveal deep insight into what drives customers’ purchasing decisions. The average customer commonly moves through a process that’s described as the “purchase decision funnel.”
There are six stages in this funnel, broken down as follows:
Upper funnel:
  • Brand awareness: share of voice (SOV) compared to competitors
  • Brand perception: how closely a brand is associated with key features for an offering (i.e., performance, reliability, cost, etc.)
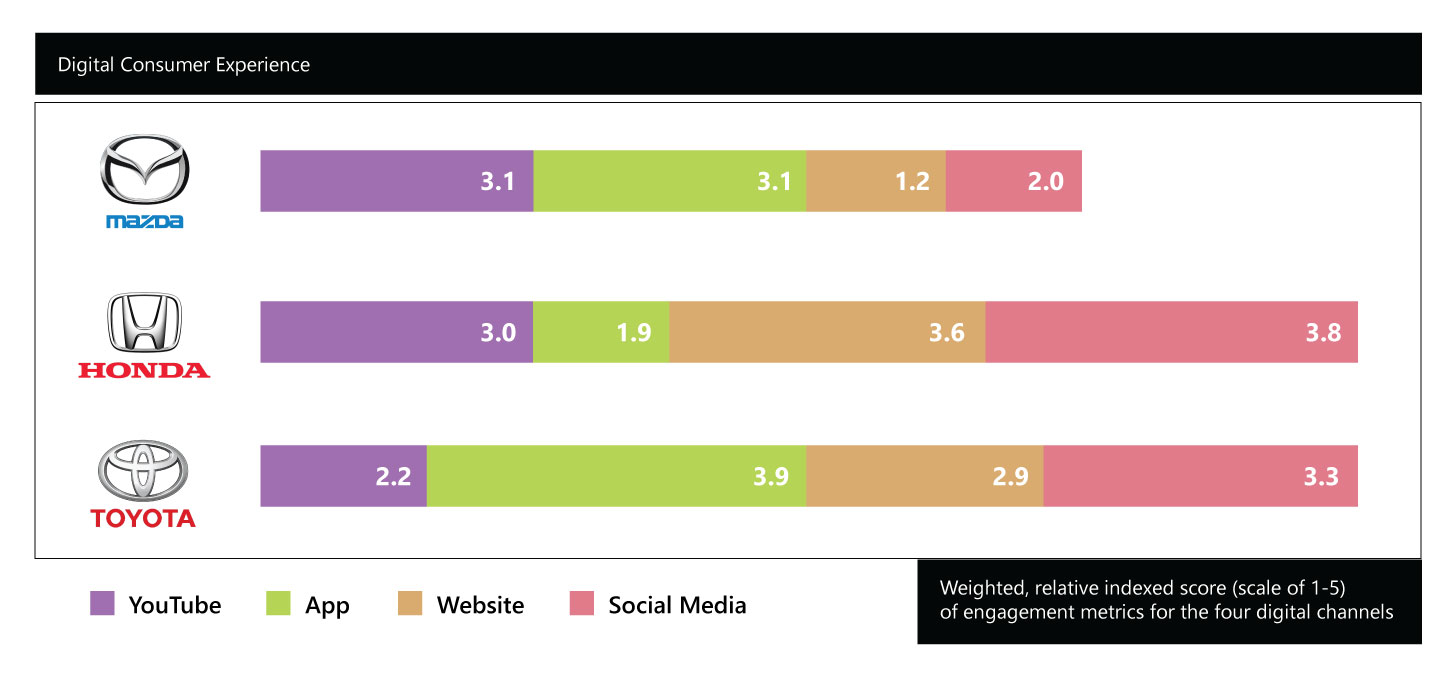
  • Digital engagement: how effectively a brand engages with potential customers across the digital channels of web, app, social media & YouTube.
Lower funnel:
  • Brand consideration: how frequently is a brand present in multiple brand conversations
  • Buying experience: how satisfied is the customer at the time of purchase versus competitor brands
  • Owner engagement: post-purchase customer advocacy
Intelligence gathered from unstructured data analytics can help brands adapt their business to address gaps in these critical areas. For instance, a brand can invest resources into improving its online SOV to influence consumers at the upper part of the decision funnel, or it can invest more in the customer experience process after a purchase to create greater loyalty and drive engagement at the lower end.
lv_graph1
The influence that higher SOV can bring to a brand is at times a double edged sword.
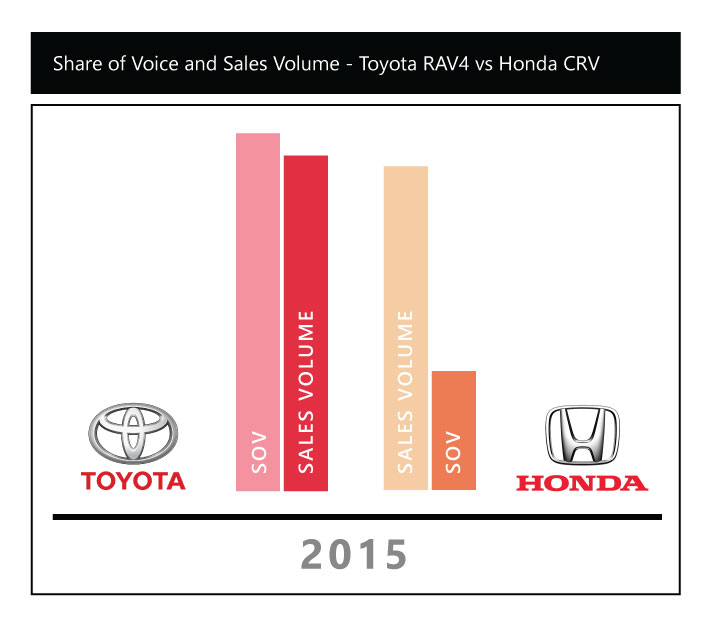
Consider the case of Toyota & Honda compact SUVs (Rav4 & CRV), where Toyota RAV4 had a three times higher SOV compared to Honda CRV in 2015, yet were roughly equal in terms of a sales volume. Toyota RAV4 was plagued by the seat belt recall issue which dominated the social conversations and potentially impacted the customer purchase decisions.
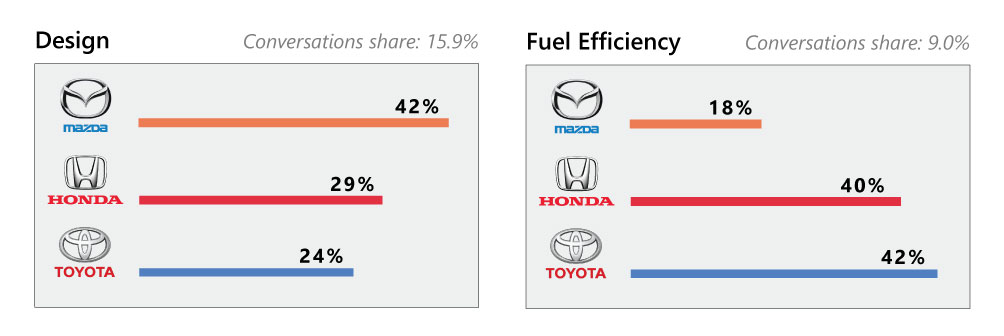
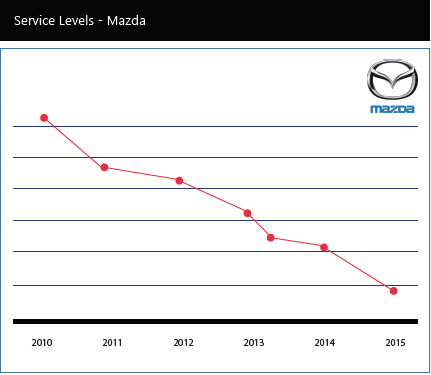
Similarly, Mazda is popular for its comfort and design among consumers and is very also fuel efficient as per internal tests data; however, consumer perception does not reflect this. Mazda’s service sentiment is also low and service levels has been on decline between 2010 to 2015. So possible campaigns need to focus on this message. Improving this could further enhance the number of Mazda brand advocates.
lv_graph2
In the one year SOV comparison between Honda CRV, Mazda CX5 & Toyota RAV4, Honda despite having three times lower share of voice than Toyota RAV4 exceeded the sales possibly due to the positivity in the conversations.  Hence, for the upper funnel it was observed that Honda has strong associations with key features like performance and comfort and Mazda has weak associations in the consumer’s mind with different features. It was also observed that Mazda is lagging in the digital consumer experience.
lv_graph3
For the lower funnel it was observed that Mazda appears less frequently in the brand consideration set. While Mazda was rated high when it came to sales satisfaction, it scored low in prospect satisfaction suggesting potential lapses in prospective customer treatment at the dealerships. Now that the indices can be obtained at a dealership level, the data could also be analyzed further to identify dealerships that need improvement and dealerships that are performing well; this will enable cross learning opportunities. Further, specific measures like product genius as adopted by Apple retail can be put to test in select dealerships and the improvement can be monitored using these indices.
The decision funnel can reveal insights into the brand perception analysis to help senior management compare expected and actual perception for their brands and fine tune messaging to enhance and modify perception as needed. Consider the case of streaming services player Netflix, considered a giant in media content. Netflix had recently lost some of its lead in shows to online streaming competitor Hulu. Prompt awareness of this change in perception using analytics to understand the change in perception would allow Netflix to make strategic decisions to rechart consumer perceptions about their shows and develop marketing campaigns or content appropriately. The analysis will also serve to continuously monitor the success of these strategic moves.
Take another example; in the case of Mazda, the service sentiment is low and service levels has been on decline between 2010 to 2015. Improving this could further enhance the number of Mazda brand advocates. Further Nissan has shown significant improvement in overall customer retention after it gained a set of loyal customers for it’s niche electric car – Nissan Leaf aided by the IHS loyalty automotive awards. The decision funnel can reveal where and why, what is lacking in your brand.
lv_graph4
If you are seeking to strengthen your brand, gain competitive advantage and boost sales and revenues, analyzing unstructured data to better understand and impact the decision funnel may be the perfect foundation for this transformation.

Thursday 19 January 2017

Determining Perception Gap Through Twitter

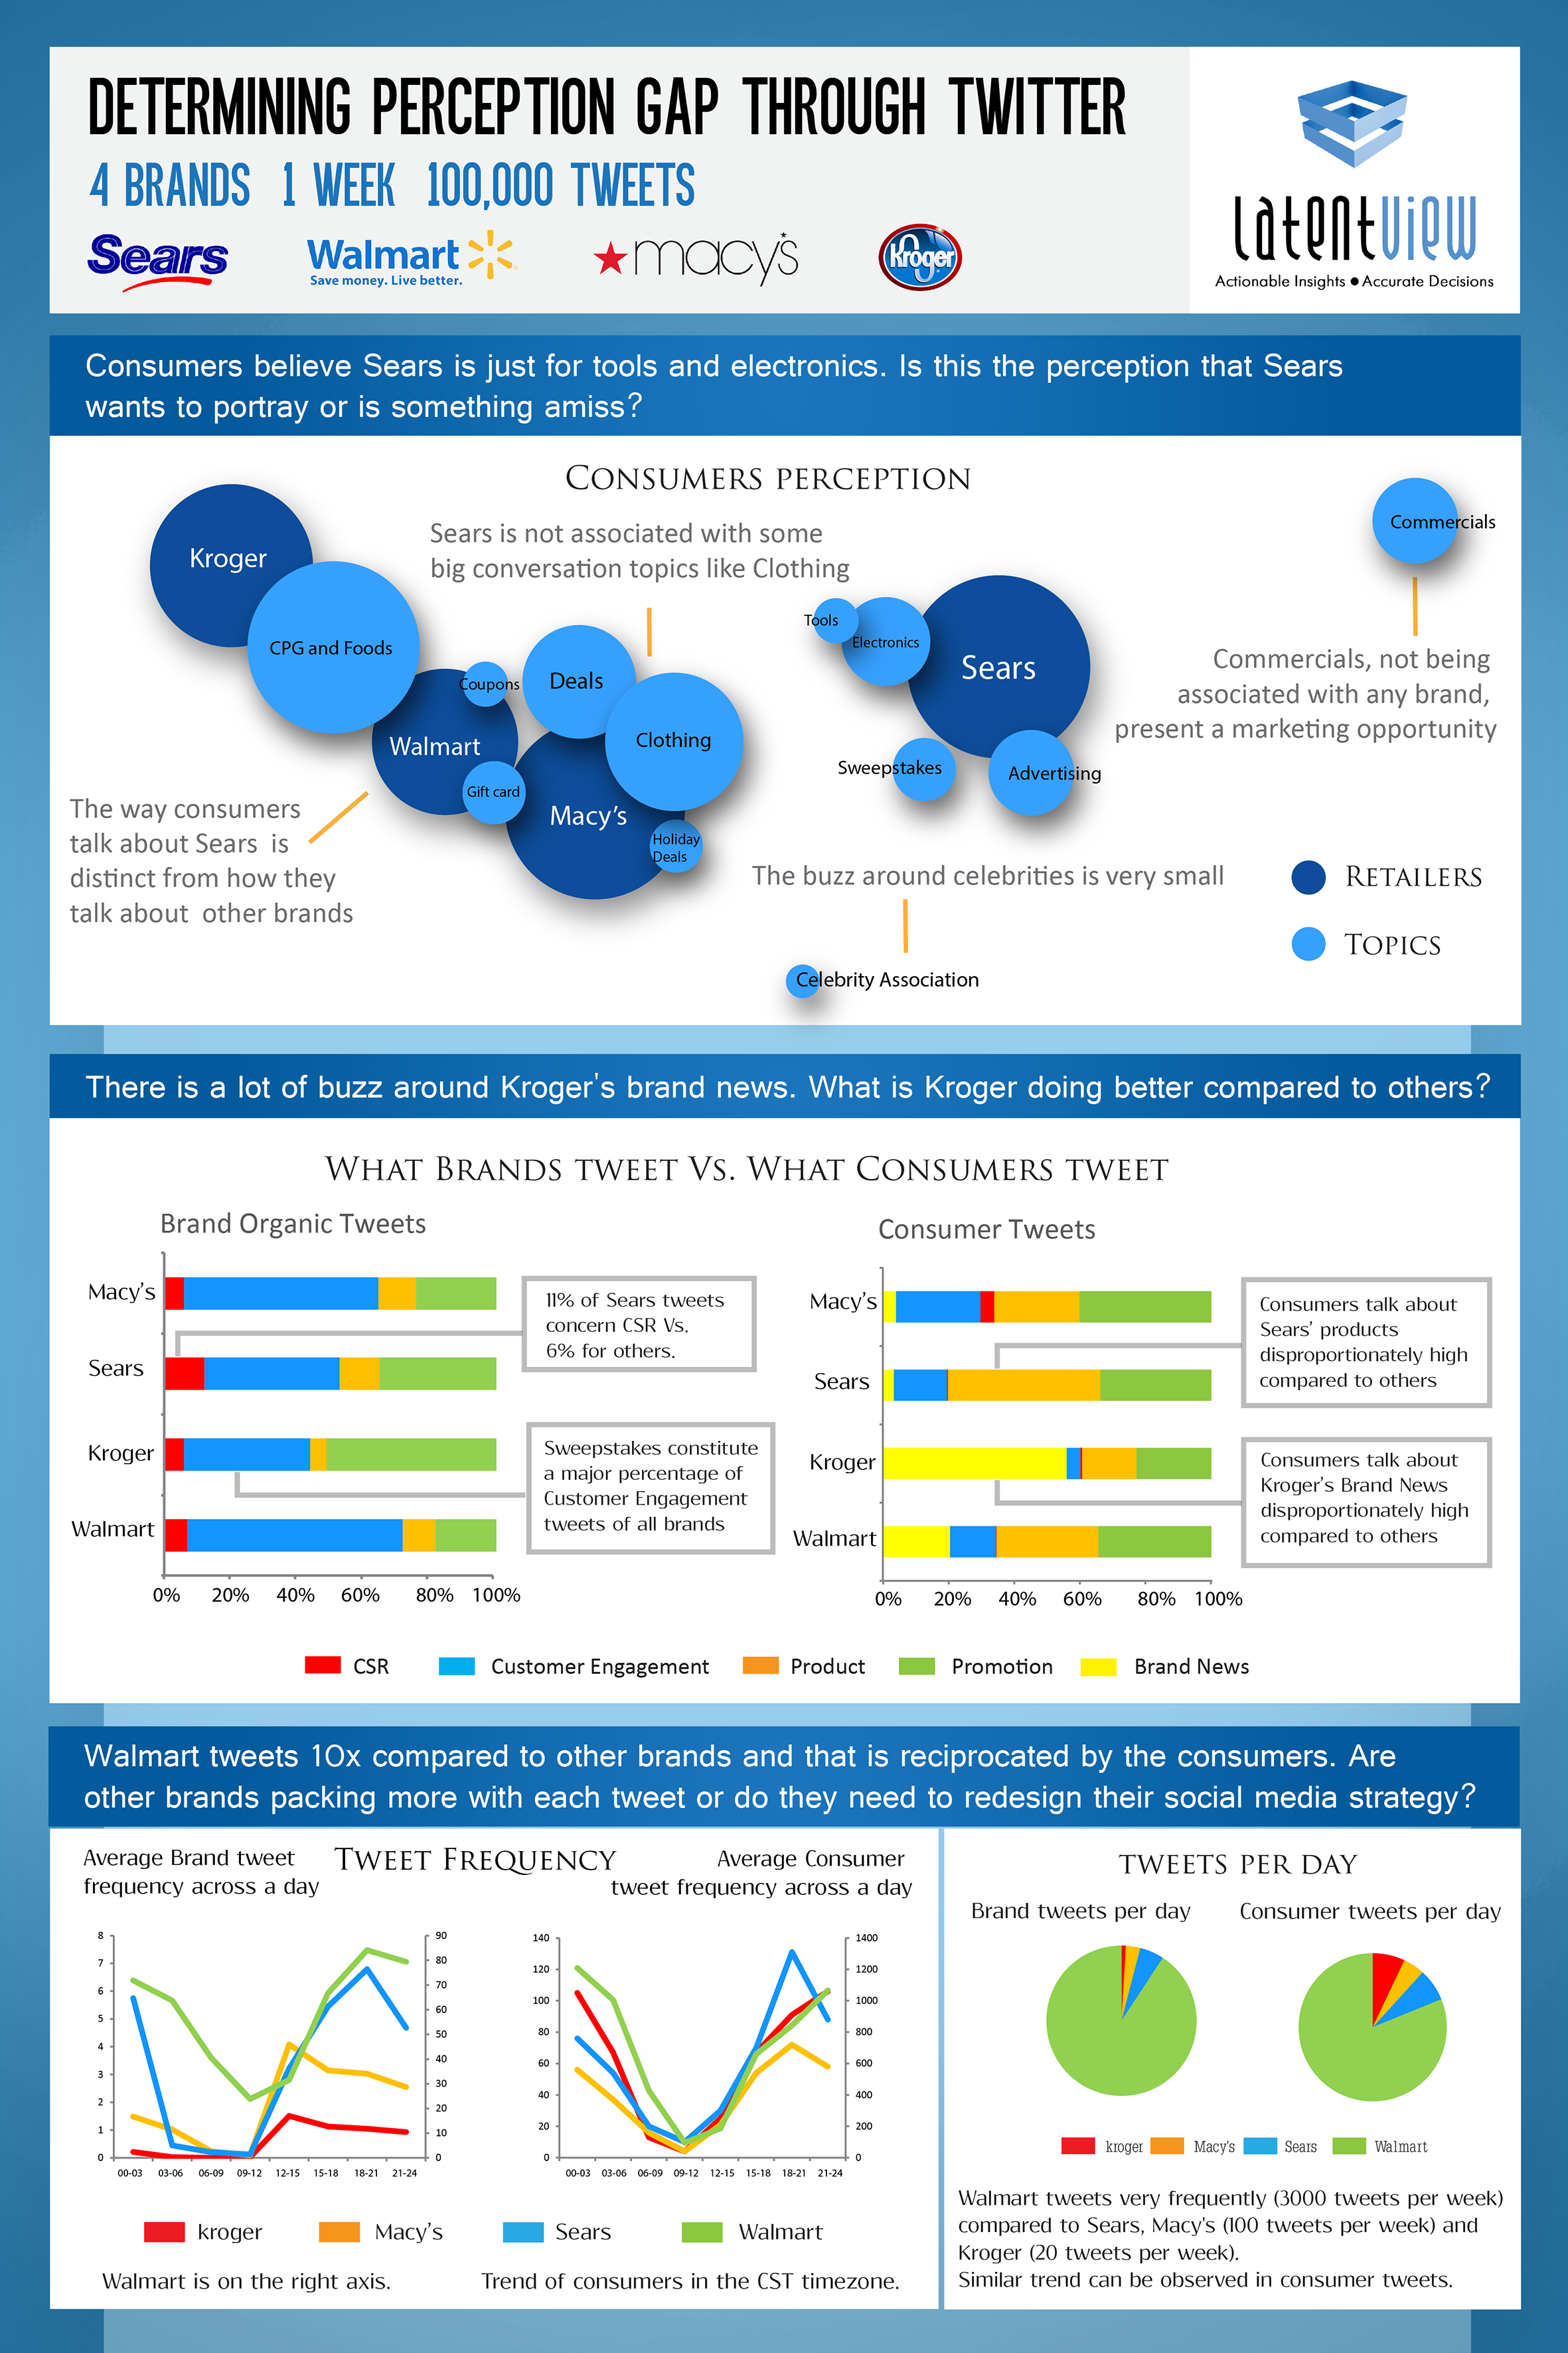
Being an analytics professional, I like doing interesting analyses on various hypotheses I have regarding what is going on in the world. Most recently, I’ve been thinking about how there is a mismatch between what the businesses portray and what the consumers actually feel about brands.
To test this hypothesis, I analyzed 100,000 tweets of four brands: Sears, Wal-mart, Kroger and Macy’s. And the findings are in line with the hypothesis. Consumers have a very specific impression of each brand which is the sum total of all the marketing efforts and in-store experiences e.g. we can see below in the first chart that Sears has a very distinct impression compared to other retailers. One surprising thing that I found in the analysis is that there is very little buzz around celebrity associations despite the massive marketing dollars which are poured into it.
No doubt, social media has become an integral part of marketing divisions but its real power– to determine consumer sentiment – is still grossly underutilised. In today’s highly competitive marketplace, businesses need to be extra attentive to what consumers are saying and what better a place to learn that other than social media, to which consumers pour their hearts out 24 hours a day in their highly connected lives through smartphones, tablets and desktops.
Infographic on determining perception gap through Twitter & Social Media
Determining Perception Gap Through Twitter – Comparison of Sears, Walmart, Macys & Kroger

What Is Your Organization’s “Age” Of Analytics Maturity?

In this first post of a brief blog series, we’ll take a broad view at how organizations, such as your own, can assess analytics maturity and what they can do to move up the maturity curve faster (and ultimately, apply analytics to do everything from drive operational efficiencies, expedite product innovation and enhance consumer experience, to boost financial performance).
Lots of organizations use analytics in some form today across their operations, but there are still too many who are lagging behind. Others, those who exhibit analytical aspirations, are interested in adopting analytics to drive business strategy, but haven’t taken proper action. There are still more who have built a platform for execution, but are either hitting wall on next steps, or simply need to evolve. Of course, there are the rare few who have reached the highest level of analytics maturity – and are successfully aligning analytics to business goals to achieve desired results.
What Is Your Organization's "Age" Of Analytics Maturity?

Where does your organization stand?
To truly answer that question, you must know where you fall within the five stages of analytics maturity – an evolution that starts with infancy, or the analytical novice, and moves through to a stage of development where organizations are executing an analytics-driven business strategy each day. To help organizations gauge this, and see what the “levels” look like from a practical business perspective, we recently developed the Analytics Maturity Self-Assessment. It’s a tool that provides organizations with actionable information to assess strengths and weaknesses across the critical analytics success factors—data, analytics processes and practices, and culture—and to provide guidance on advancing to the next stage.
Here are the first two stages on the maturity scale which are addressed in the self-assessment. Does this sounds familiar to you? If not, that may mean that your organization has taken more of an evolutionary “analytics” leap than you thought. 
Stage 1: Analytical Novice
This is the base level of the scale. Companies in Stage 1 may be lagging behind in adopting an analytics strategy to drive business decisions, potentially eroding their competitive edge. The development of a sound data management strategy has not begun yet or is in its infancy, and data quality and consistency may be poor. Analytics is driven mainly by the use of spreadsheets, and business leaders need to gain a better understanding about the value of analytics.
One hint for advancing to the next stage: By setting up a discovery phase to identify use cases for data-driven decision-making, you can select a business goal (marketing campaign effectiveness or supply chain demand forecasting, for instance) that can benefit from comprehensive data analysis.
Stage 2: Exhibits Analytical Aspiration
In Stage 2, progress has been made and it is evident that the organization has an interest in adopting analytics to drive business strategy has been developed, but these interests still need to be augmented with action. The organization has identified its need for data infrastructure, but the strategy team is not participating in discussions about analytics usage. In this stage, business leaders are curious about using analytics, but they have not established a clear vision of how to continue.
One hint for advancing to the next stage: Kick off analytics training programs across business groups to familiarize and retrain team members and encourage them to participate in crowdsourcing competitions. Get your teams excited to use analytics!
We realize that this just scratches the surface; therefore, we encourage you to reach out with questions, and we’re happy to delve further into either of these areas.
We can’t emphasize enough that no matter your market sector, a sophisticated analytics operation doesn’t happen overnight. It requires the right mix of ingredients—technology, culture and data—to come together in an effective way. In fact, over a two-year timeframe, LatentView’s research has shown that companies with a culture that encourages practices that enable the effective use of analytics progress the furthest toward analytics maturity. We’ll address this more in coming posts.
Be sure to keep a look out for insights on steps 3 through 5! But, if you can’t wait to see where you stand, click here to complete the assessment now.

Mastering Customer Retention Using Data

In the halls of marketing fame, customer acquisition stories get all the attention while those involving retention are rarely discussed with the same fervor and enthusiasm. Yet, most marketers will admit in private that customer retention is the single most important priority and an integral part of their strategy, which significantly impacts their bottom line. According to global consulting firm Bain & Company, it costs six to seven times more for an organization to acquire a new customer than to keep an existing one.
Increasing customer retention and loyalty is particularly relevant for retailers as they attempt to grab market share in a competitive environment. But how exactly can retailers identify and create loyal customers? Mere numbers — visits to a website, for example — do not tell us the full story of brand affinity unless they are also accompanied by other critical indicators regarding attitude or perception, and sentiment or advocacy toward the brand.
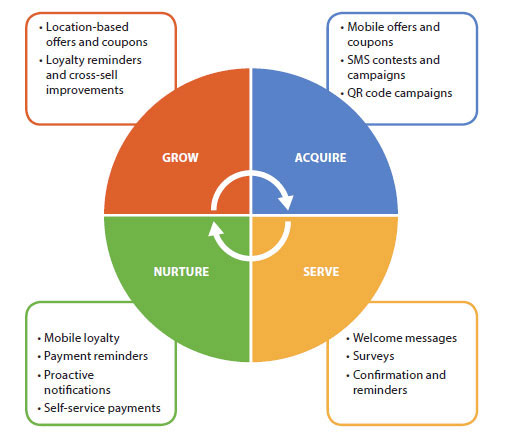
In creating a loyal customer, retailers need to first segment their customers based on their specific phase in the retention cycle. During each phase, data analytics can aid and support their outreach and marketing efforts.
blog-bad-cust-exp
When it comes to acquiring a new customer, retailers typically use a variety of channels to draw customers into their stores. These include advertising, promotions, affiliate programs, referral programs, coupons, rewards and other incentives. By effectively leveraging data analytics during this phase, retailers can ensure that these efforts are more than just random attempts at attracting customers.
How exactly can data help? Some of the ways analytics can be leveraged include better attribution insights or clues into what leads prospective customers into their stores. By identifying and gaining insights on better understanding the motivation of potential high value customers, retailers can redesign their promotions and product mix to attract such customers.
There are several ways in which a combination of internal and external data from CRM systems, transactional reports and demographic databases can be pieced together to get a better picture of what drives a customer to consider a purchase. When such information is combined with geographical data gleaned from mobile devices, it gives retailers a location-based map of customer sentiment and inclination. This can help them target customers with timely promotions and updates. For example, a customer could get a notification about a special discount on running apparel in a sporting goods store as soon as they step into a mall where that store is located.
Retailers often believe once a customer enters a store, online or brick and mortar, and make a purchase, they are a potentially loyal customer. They are entered into a database and the retailer begins treating this group (customers who have made a purchase) as a homogenous entity, running campaigns and offers to convert them to “loyal customers.” But they often do not meet with much success and have a very low conversion rate. The reason for this is customers all have different stages of brand involvement. To begin with, it takes a certain number of transactions before a customer and their purchases can be classified as intentional and not merely impulsive. What that number is changes from business to business, but a look at historical data can very quickly help define that threshold.
It is within this customer set, the ones that have reached the purchasing threshold, that you begin looking for “loyal customers.” Analytics can help create models based on historical data as well as external data, like wealth credit scores to predict high net worth customers, or common patterns of behavior, sometimes referred to as DNA markers. Customized campaigns directed at this segment will have greater success and higher conversions.
Ultimately, customer experience and satisfaction holds the key to driving repeat purchases. This is certainly more important in some sectors versus others. In the travel and hospitality sectors for example, positive customer experiences are essential for repeat transactions, while negative experiences could stifle this portion of business completely. Again, retailers can turn to data analytics in order to isolate bottlenecks and constraints that result in poor customer service or — in the case of an online business — cause customers to abandon their purchases.
As is clear from all of this, customer retention is a critical process that requires an understanding of where a customer or prospect fits in the retention cycle. With this understanding in place, data analytics can come in to help marketers cultivate the quality they most value in their customers — loyalty.

A Roadmap To Optimal Analytics Maturity

Note: Krishnan Venkata, Vice President- US West presented a paper on ‘A Roadmap for Optimal Analytics Maturity’ at the Chief Data And Analytics Officers Exchange in California, early this year. A summary of his presentation is captured in this blog post.
We’re often asked by our customers what the ideal roadmap to analytics maturity is. Like with most great questions, there is no single right answer. There are multiple factors that need to be evaluated, measured and understood in relation to each other.
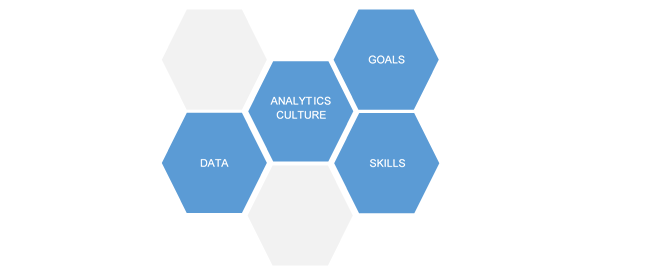
The Davenport Delta Model lays out a simple but comprehensive framework to measure analytics maturity. It goes on to outline critical factors that influence the movement from one stage to another. Based on our experience of having worked with companies of varying sizes across verticals and levels of maturity, we have found that the factors outlined by this model hold true; availability and quality of data, analytics culture of the organization, alignment of analytics target to the business, and availability of analytic skill are the basic building blocks for analytics maturity.
analytics-culture
Figure 1: Primary success factors in attaining analytics maturity
Data:
In a survey conducted by LatentView Analytics, 70% of analytics heads identified data quality as their primary challenge. Unavailability of data, incomplete or missing data, and outdated data were the three most commonly identified contributors to poor data quality.
When it comes to data availability, the vertical in which a company operates and its business model have a significant influence.
CPG companies, for example, are plagued with a lack of transactional data as the end purchase happens at retail outlets. Conversely, retail businesses have ample transactional and consumer data but have limited access to sensor data that can give them insights into consumer usage patterns.
So, how then do companies get past unavailability of data? This can be done by building a unified analytics layer that captures data from multiple digital touchpoints (websites and microsites, social media, interactive displays, kiosks, sensors etc.). This data can then be combined with unconventional sources of data that are publicly available (social media data, company filings, syndicate data – credit card companies, credit rating bureaus etc.)
Another common challenge faced by companies is missing or incomplete data. While the data stream for a particular variable exists, it might not be available for a specific time period. In such cases, the following methods can be used to address the problem.
• Imputation of variables – where best possible approximations are made by running different scenarios from historical data and past trends.
• Scenario based approximations – where approximations are made when data is completely missing by assuming different scenarios based on empirical guidance from the market, such as increasing/decreasing growth rates.
• Rolling averages as derived independent variables – works best when there are no spikes or unexplained outliers in the data stream.
• Adjust the granularity of analysis – increase granularity of the model and analyze monthly data, say, instead of weekly data.
Culture:
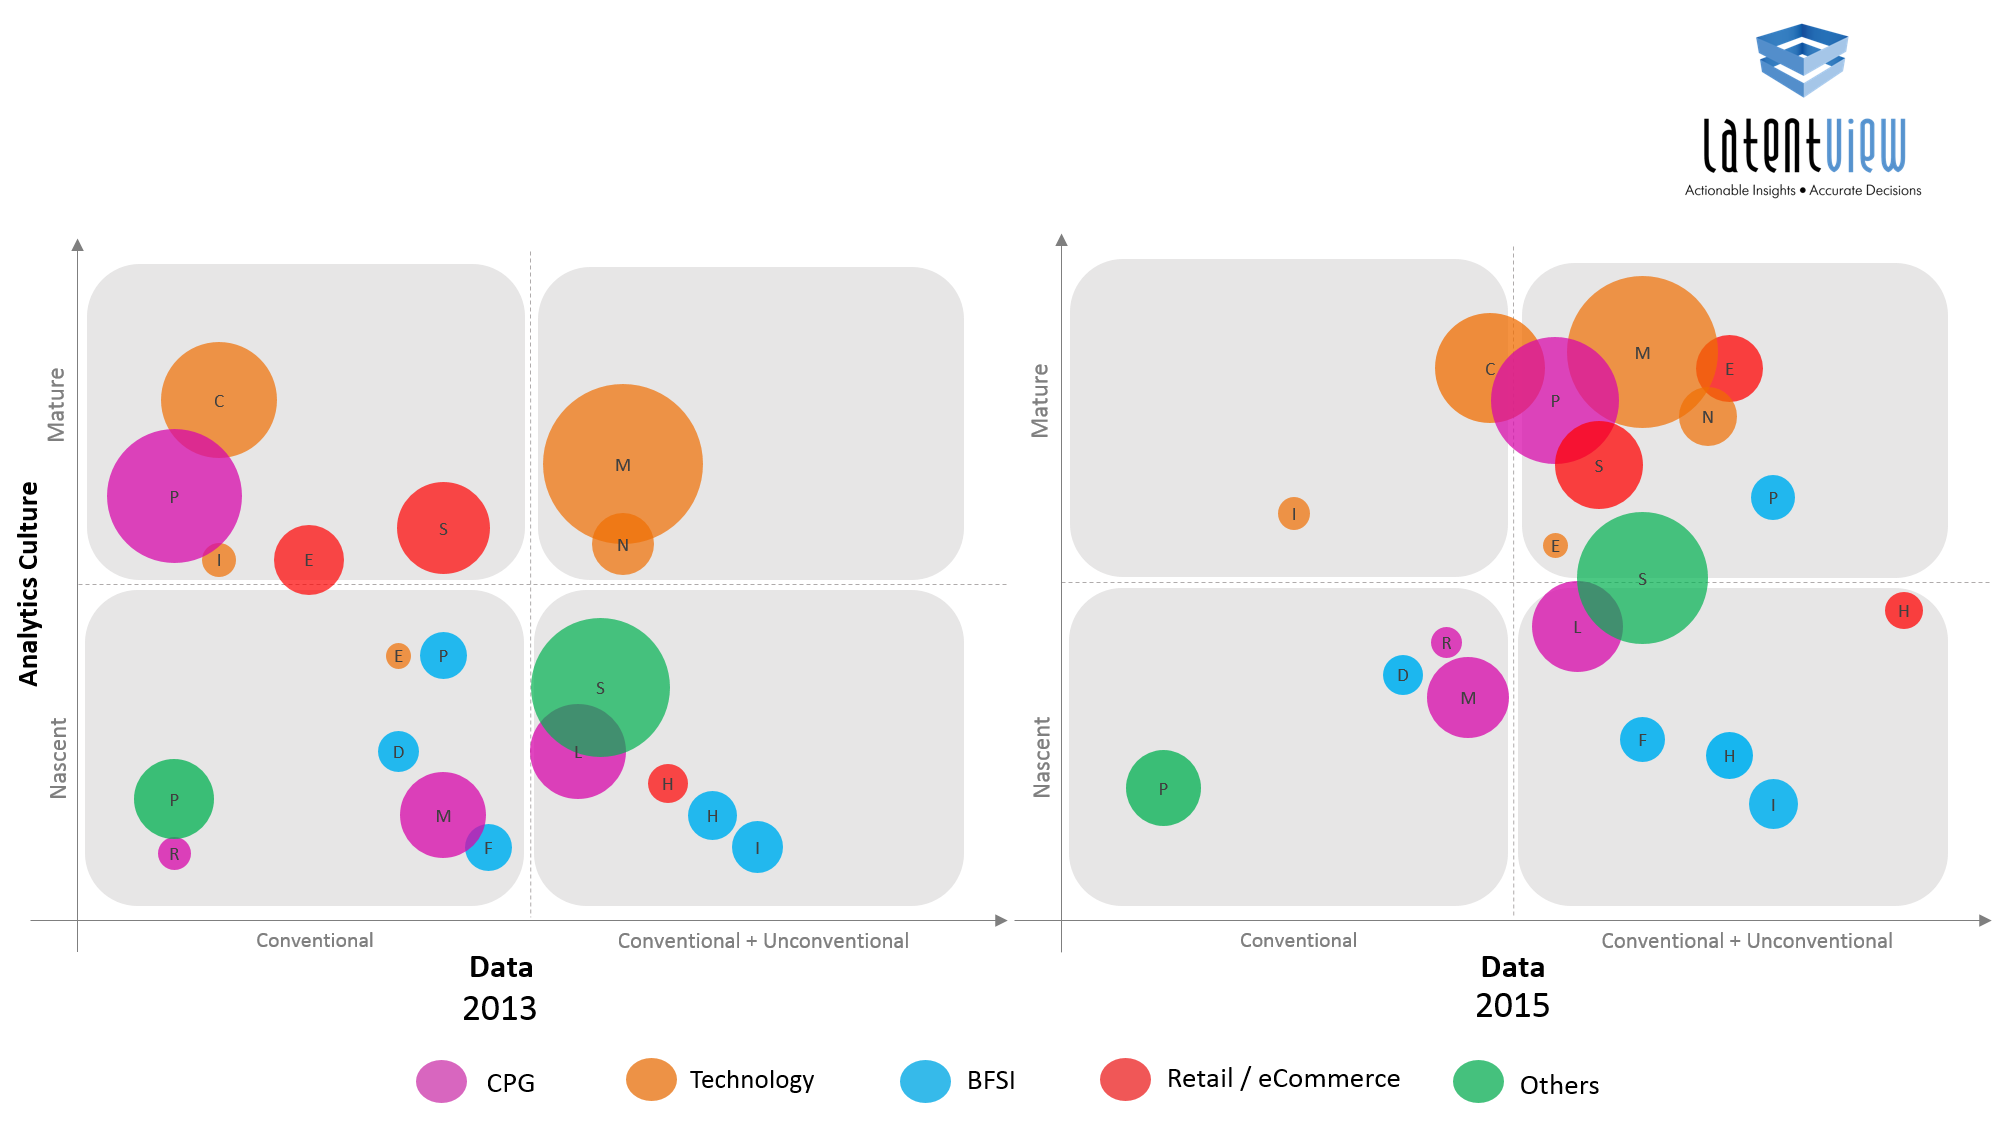
One of the most important factors when it comes to determining optimal analytics maturity is the culture of the organization. Is the company data-driven in its decision making or not? When we mapped few organizations that we have been interacting with on a grid that measured culture vs. data, we found that over a two year time frame, companies with a high culture (irrespective of their industry vertical) made the maximum movement in the amount of data they were using (they were combining conventional and unconventional data sources.) In our experience as well, we believe if the organizations have the right culture, the challenge of data for analytics can always be overcome.
correlation-culture-data
Figure 2: Correlation between culture & data
Goal:
In the early stages, analytics goals are often disconnected from the larger business. A lot of the analytics effort goes towards addressing a limited set of targets – mostly operational KPIs of specific business functions. Companies that are high on the maturity curve have a very strong alignment between analytics goals and the company’s strategy.
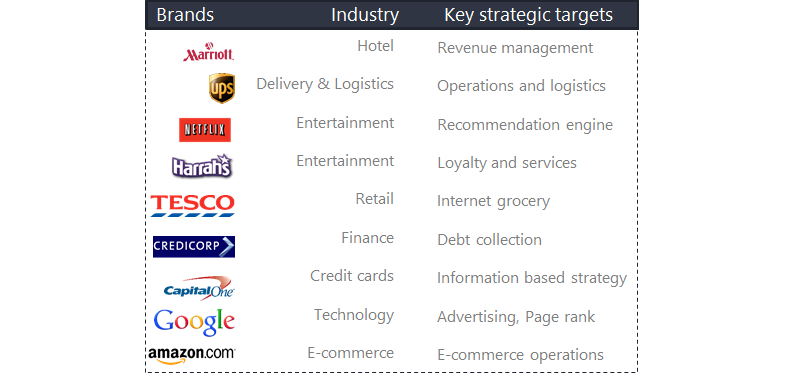
We have companies telling us all the time – we have this load of data, can you give us insight? I think this is the wrong way to look at a problem. We need to first identify problems that are key to the business and where analytics can not only help, but also provide a competitive advantage. The companies that have got this right include Google, Netflix, Amazon.com, Tesco, UPS, Marriott, Capital One, and Credicorp, to name a few.
brands
Figure 3: Companies that have mapped their analytics efforts to strategic targets
Skills:
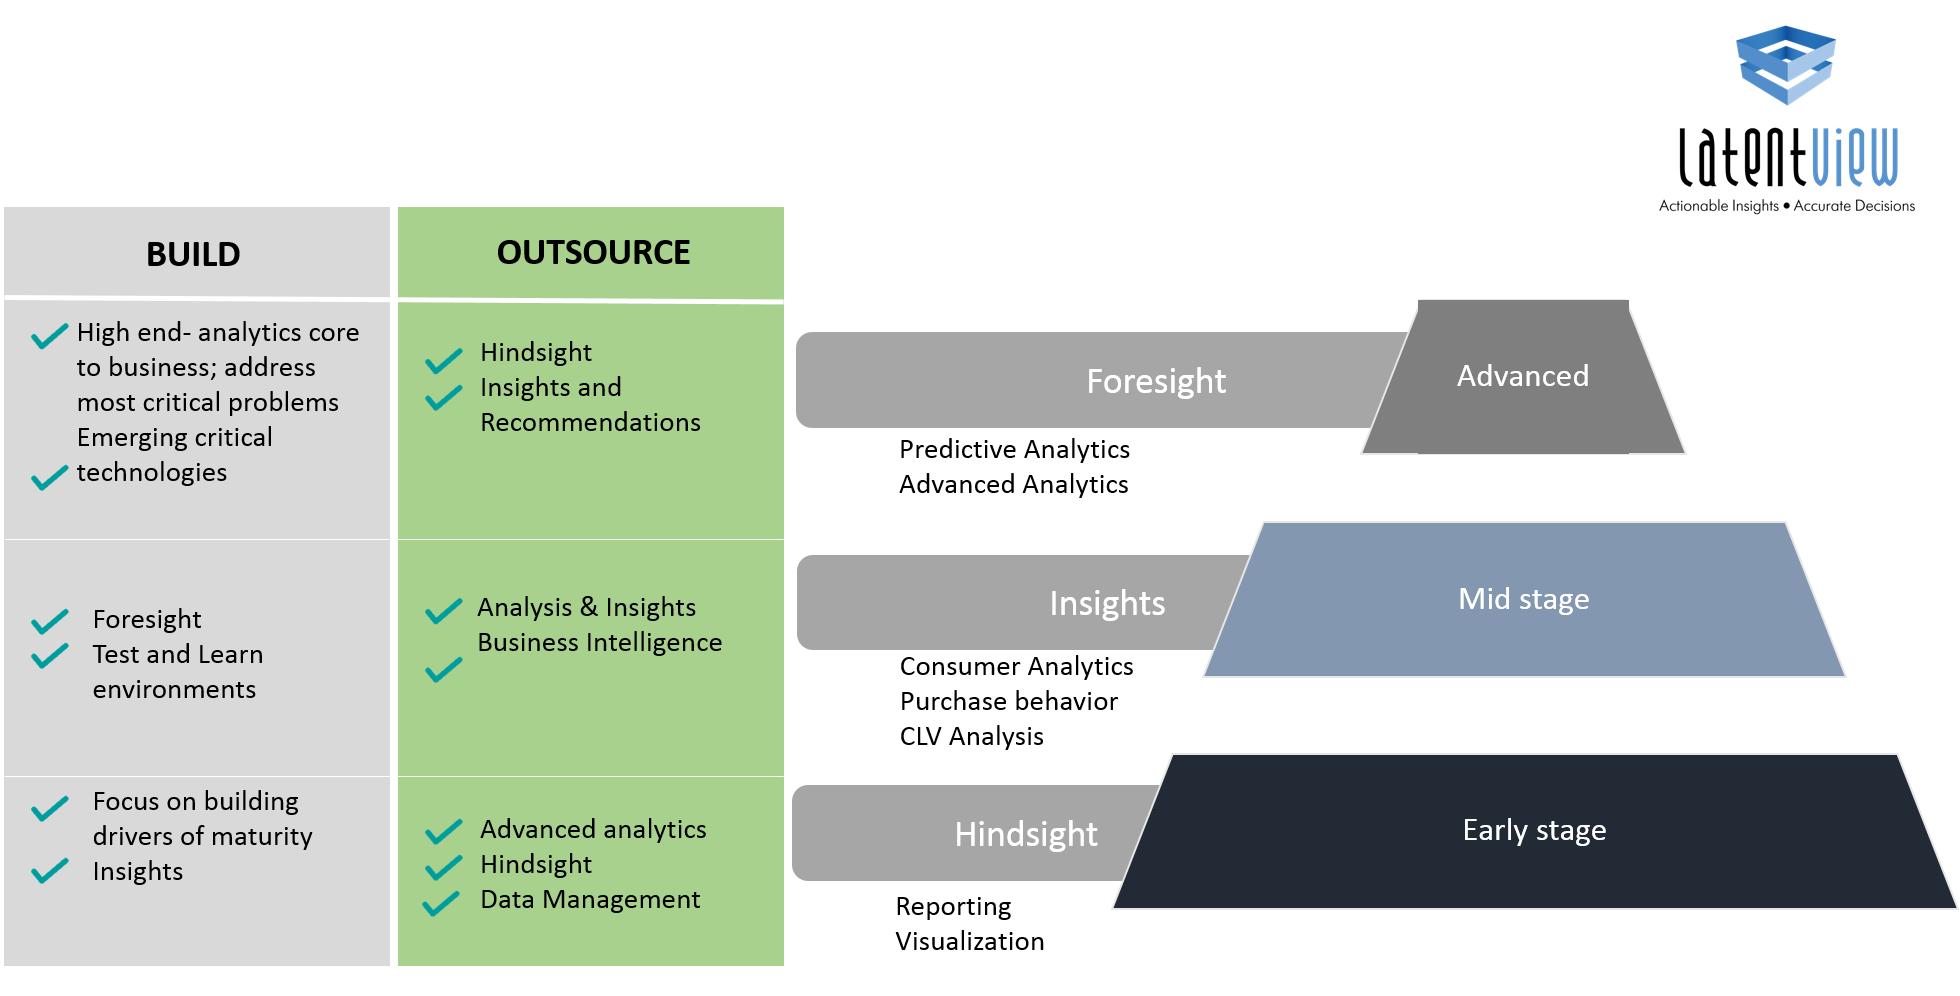
Depending on the stage of maturity they are in, companies should look at what they should focus on building in-house and what they should outsource, depending on their goals. Based on our experience working with a wide range of clients across the maturity curve, we have mapped what organizations should build vs. buy depending on the stage of maturity they are in.
skills
Figure 4: Mapping skills to analytics maturity
In the early stages, companies typically use data to get a ‘hindsight’ view. They need skills of reporting and visualization. They need to focus on building drivers of maturity – improving their data quality, increasing the analytics culture of their organization by demonstrating the benefit of using data in decision making. Depending on budgets, they can also look at building ‘insight’ capabilities. At this stage, they should look to outsource everything else – advanced analytics, data management as well as hindsight, to scale quicker.
>In the mid-stages, companies have the size and skills required to build on their ‘insights’ capabilities. They typically begin understanding purchasing behavior, conducting CLV analysis and advanced consumer analytics. This is also a good stage to begin experimenting with test and learn environments. Towards the latter part of this stage, companies typically begin doing some amount of advanced analytics and predictive modeling. Their focus should be to outsource reporting and data management and focus on building core advanced analytics capabilities
In the advanced stages, data analytics is now influencing strategy. At this stage, companies should focus on building in-house teams to do the advanced analytics work that is core to the business. They should also be evaluating emerging technologies that will have a significant impact on their business or industry. They should ideally be outsourcing other areas which can be more easily accomplished by partners while they invest their internal teams towards the strategic analytics initiatives.
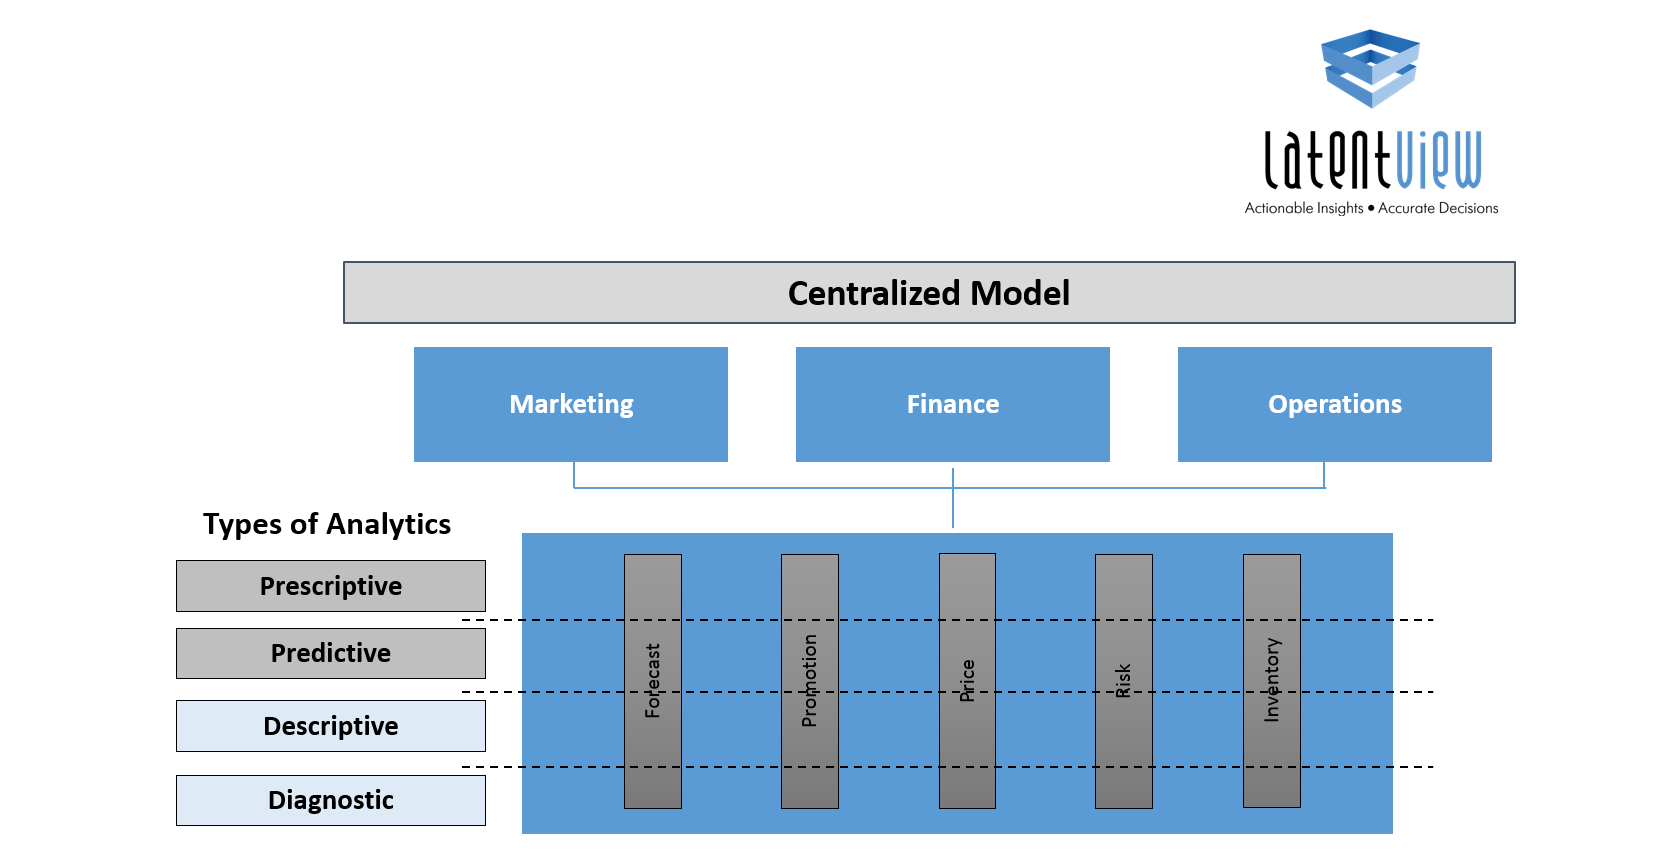
We’re often asked by our customers what should be the ideal analytics structure – should it be centralized or decentralized?
Centralized model or the pooled resource model is great for efficiencies as the organization relies on a shared pool of resources to accomplish its analytics needs. Typically, early stage organizations use this structure to demonstrate success and when there is a lot of BI, survey and reporting work as there could be leverage in terms of reusable templates and pricing benefits on scale. However, the limitation of using this model is that while you can develop deep analytical expertise, the team lacks business context as they are shared across multiple teams.
With the decentralized model, there is a lot more context and insights generated as the analytics function is housed within the business units and is also responsible for the business goal.
hybrid
Figure 5: The hybrid analytics structure
However, the biggest limitation of this model is that the analytics teams being part of a business unit can be questioned on whether they can now evaluate the business unit performance objectively. Also, the analytics teams are often stuck in block and tackle mode and have little time for innovation. We typically see this structure in large organizations with complex hierarchies.
The ideal model is a mix of both which is a hybrid model which has the benefits of scale and efficiency that the centralized model provides, and the benefit of business context from the decentralized model as there is a loose coupling between sub-teams and business teams. As organizations mature, irrespective of whether they started with a centralized or decentralized model, they gravitate towards the hybrid model over time.
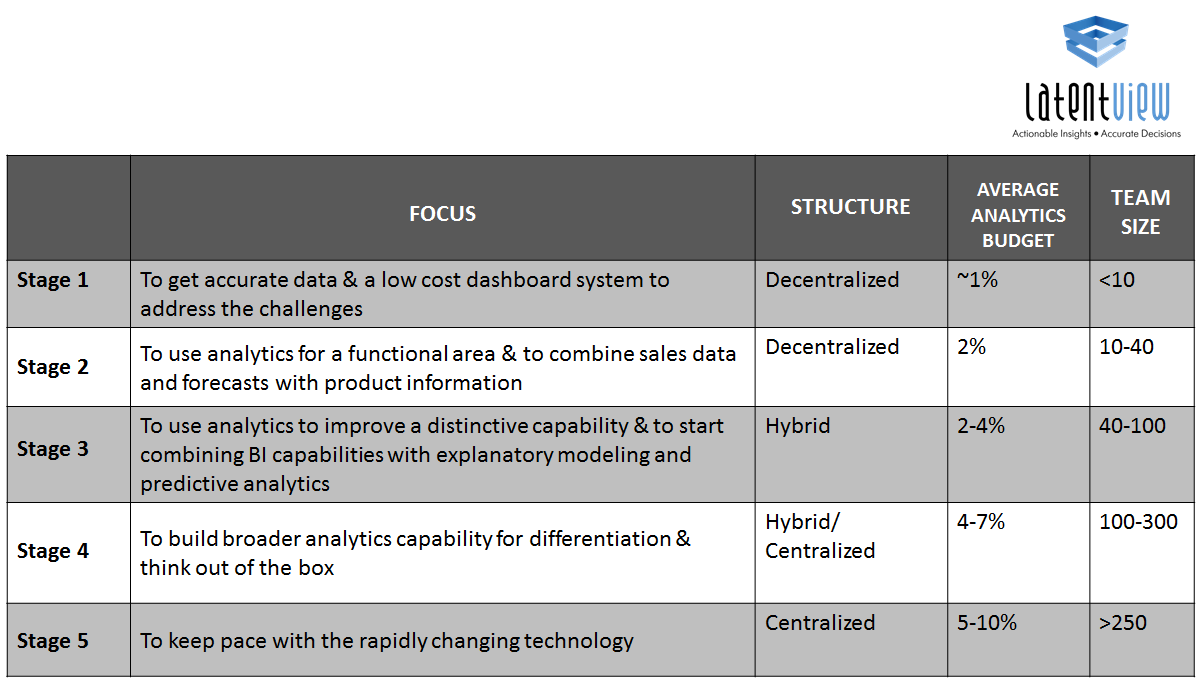
structure
Figure 6: Mapping budget & team size with analytics maturity
Lastly, I would like to share typical team structures, sizes and budgets seen across organizations across the maturity life cycle. There is not one single path to optimal analytics maturity. However, the key is to identify where your organization fits across different levels, map the current maturity and identify the steps needed to go to the next level.

Wednesday 4 January 2017

A Fireside Chat with Jeroen Tas, CEO, Connected Care & Health Informatics at Royal Philips

Very rarely do you see CEOs that also have a CIO background. How did you look at the same data world when you were a CIO, and how are you looking at it now?
Well it’s interesting. The reason I came to Philips is because Frans van Houten, CEO of Philips, called and asked me questions like “How do you think Philips’ business is going to change in the digitization phase, or when we turn products into services?” He then told me that he considers digitization to be really important for the company . He mentioned that Philips had some IT-related issues that needed to resolve but he was seriously thinking about what IT would mean for the business in the medium-to-long term.
He asked me to work with Philips chief strategy officer to understand the ways to change our business to tap into the opportunities of digitization. I remember telling the leaders to embark on some of these journeys together. We put ourselves in the shoes of a pregnant woman who goes to the hospital to find out whether there are some complications in her pregnancy. How does she deal with it? How does she communicate with her caregivers? What happens during delivery, how does she care for the baby after delivery and while raising the child?
Now these are critical life events—pregnancy, your first child, your second child and so on. These are really intense emotional events. Many of us have experienced this and looked at the connection between the mother and the professional care providers – tools, services and information the mother may want to better understand her situation and take control of it.
Consider a few more use cases. What if your husband is diagnosed with heart failure? How does it change your life and how do you deal with it? What if your father passes away and your mother wants to still live in her home, but she has multiple chronic diseases and is at a high risk of falling? I have a good friend who lives abroad, he calls his mother who lives in Bombay every day. He is really worried about her, so he calls for two reasons: one to know if she is answering the call which means she is fine, and the other reason is to make sure she is taking her medication. The question becomes, how can one support an elderly parent with multiple chronic deseases at home?
Now these are very important use cases. When you start looking deeper you realize that it is important for healthcare organizations to really connect with their customers: patients. For me, the definition of digital is very simple – it is continuous engagement. How can you continuously engage, learn and get better in supporting people.
Everybody can relate to this through their own health journey. There are huge gaps that exist today when it comes to professional care. Healthcare is organized around acute events like going to a doctor when you are feeling unwell. The doctor sees you, and possibly refers you to a specialist, who may prescribe medication or a course of treatment. Often there are weeks or months in between these visits.
In healthcare, real-time systems are needed, especially when situations are dire. For example, if I collapse with a stroke nobody knows who I am, my health background, the allergies I have, what medications I am taking or what my medical history is. Yet, I can go to India, stick my card in an ATM, even in Kashmir as I recently experienced, and get money because I’ll be identified and my transaction will be approved in real-time. My bank knows whether they should allow me to take out money or not. This demonstrates the tremendous need for digital in healthcare – to deal with day-to-day management of chronic disease as well as acute events.
One of the challenges our customers face is getting top executives’ approval of their ideas. The challenge here is that even though their teams have a pretty clear idea of what they want to achieve and how they will go about it, they do not know enough about the end-game. What would be your advice to them? How should they package their strategy for the executive team?
There are a couple of ways to approach this. First, you have to understand where you’re going. You need to have a clear vision and a passion for that vision, because passion supplies the energy you need. The second condition is that you have to introduce the concept of a dynamic business case – a business case with a fully iterative approach. The art is to have clear gauges along the way. Say I have this great idea. I have a sense of how I am going to do it, but I don’t know exactly which road I am going to take. Without an obvious need you can’t make a great proposition. Just connecting an existing product won’t do the trick. It should be the other way round. Identify a clear need, create a clear proposition around it and then look at how to enable the continuous engagement.
In a digital world, you connect early in the product development process and co-create with customers. We set up the HealthSuite Labs to do just this. We still have a traditional visitor center, but it’s my prediction that the visitors center is going to gradually disappear. Our customers want to co-create. The cool thing about co-creation labs is that you collaborate on a joint vision. We have done spectacular stuff in this area. We have actually had the CEO of a large hospital, two home care organizations, five physicians and five patients participate in a lab and we were all creating the patient journey, something which none of them there had ever done.
Most systems in the world are designed for one to three perspectives. Very few systems are designed for 10 different perspectives. So, I think that is the art when you bring people together and you go through the design together. You let them feel ownership and then you empower them to jointly improve on that. So that’s the iteration.
And yes, I think a lot of executive team members have to change their way of thinking. If you come from a product world, especially medical products, you have to laboriously specify everything to the tiniest detail. There will be hordes of people who want to say no; everybody wants to protect the downside. But, so there is no upside if you don’t push the boundaries, take some risks. This is when you have to introduce entrepreneurial thinking and say of course we understand there are constraints and potential issues that we have to live with, but that doesn’t mean it should take five to 10 years to develop a product. You have to get early feedback and let the feedback drive the way you develop. Now that’s a different mindset.
In large organizations with tens of thousands of employees, there is this small analytics team with 20- or 25- people recruited from companies like Amazon and Google. They are considered the cool guys. After a while, these cool guys start complaining about the ‘old’ part of the organization. The organization complains that they don’t know what these guys do, they look like my children but they are making more money than me. So my question is, while introducing analytics into a large organization, where should it reside – centrally, with the businesses, or is there a roadmap?
Ultimately, it’s got to be in the business. For example, Egbert van Acht, CEO Business Group Health & Wellness at Philips Consumer Lifestyle, knows his business really well. He starts looking at what data and connected propositions can do for his business. He jumps on the bandwagon and his team starts creating some really cool propositions with toothbrushes, pregnancy monitors, etc. So, the cool guys are only going to be successful if we have leaders like Egbert who say I want to experiment with this. I want to learn quickly. I know I am not going to get it right the first time, but I’m going to get it right eventually. I will hire people on my team who understand and love this idea and that’s the way we are going to do it. If it’s not really embedded in the business, it’s not going to succeed. You can have the coolest small team in the world, but they are not going to change the company.
It’s great that you have mentioned real time connectivity and a connected world. It’s important and certainly possible in the western world where data is consistent and surmountable. What is your take on the developing world where the population is large and data is disparate? How do you see it connecting?
I have talked about pregnancy. Both in India and Indonesia there are very high instances of maternal mortality and typically these are a result of simple causes. We have started looking at how we can address this problem at scale because there are just not enough specialists in countries like Indonesia, for instance. For example, in a population of 250 million people spread over 15,000 islands, there are only a couple of thousand obstetricians.
The fortunate thing is that they have very good mobile coverage. So clearly the answer to your question is mobile technology. We need to allow midwives, to visit pregnant women and start measuring basic vital signs. They can use a simple doppler to get a sense of how the fetus is developing and growing. This device is connected to a mobile phone via an app. We created a backpack for the midwives with the tools to diagnose pregnant women. The data is collected and uploaded to the cloud. This data is analyzed using algorithms. The system helps in identifying the cases that are critical and require attention of a obstetrician.
Therefore, you can dramatically improve coverage and you can apply this model. As a result, an doctor sitting in Jakarta can now handle 300 patients a day instead of handling 30 patients a day. The model is very straightforward. You give people simple tools and analyze the data. Sometimes simple tools go a long way.
There has been virtually no enterprise automation in healthcare. It has always involved people and more people. Now is the time we can break this cycle and start using simple devices, data and, of course, mobile technology. We aggregate and interpret the data to allow decision making so that the specialists – a cardiologist or a dermatologist – can do this at very high volumes and increase their capacity not only by 20 percent or 30 percent, but by more than 500 percent.
These models are starting to work around the world. We are now working with leaders like Dr. Shetty in Bangalore on what we call “massively scalable healthcare”. Of course, he is a visionary and the world’s best cardio surgeon. His hospital has 7,000 beds and they have created a whole medical city around it. It’s amazing that he is doing cardio surgery for $1,500, while in the United States, you would pay a hefty $100,000. That’s kind of efficiency we can create if we are lean and work at scale with automation.
What type of business models do you want to put in place where a company like a Philips is looking at moving from a product to service or platform? How do you see that as a future?
Moving from offering products to services can be very beneficial for a company. I can sell you an MR machine for $2 million. I conduct that transaction and move on to sell another MR machine to another customer. Now, what happens if I sell it to you as a service? I’ll get that continuous engagement with you because I’m not going to just help you to optimize how the machine is going to work, but I’m also going to take it one step further and look at how I can optimize the asset and the environment in which you use the asset. And, it doesn’t end there. The more I know about the patient I can automatically configure the device. I can help you with the workflow. I can see where there is a bottleneck and over time improve the technology. I can help create better outcomes for patients.
We are doing it with patient monitoring as well. We have 53 percent of all patient monitors in the U.S. and everybody asks me if am afraid of commoditization. My answer to commoditization is monetizing as a service. What am I going to offer? Of course I’m going to offer the best high fidelity monitoring, but I’m also going to provide clinical context on monitoring in-patients – something that no company knows as much about as us.
We have a profile of patients that we mash up with real-time data and, as a result, we have started seeing things. We can now predict 24 hours in advance if somebody is going to get a cardiac arrest and that means I have a 24-hour window to intervene and avoid an acute event. We can see early symptoms of potential infection and can optimize length of stay of patients in the hospital. We know exactly when to discharge a person without a risk of that person coming back for the same ailment, which can be costly if, like in the US, readmissions within 30 days after discharge are not being reimbursed.
We just created this proposition for wearables, so if you discharge somebody from the hospital you can still take to monitor the patient from home. We are now giving caretakers a continuous engagement with their patients. Instead of being a B2B provider of products which we are today, we are transitioning to become a service provider and, ultimately, we are going to help our customers continuously engage with their customers (patients).
Yes, it will have an impact on our short-term revenue, but it will have a huge positive impact on our future revenue. We are already running health informatics as a service. Now we have to focus on growing from the base and establish the more predictable stream of recurring revenues.
I can see real big benefits coming for Philips from this transition in the long run. What is your single biggest issue in adapting this business model?
While designing a product you go through endless cycles to get it perfect and then launch. You will then find out what customers think of it. Then there is another six months to a year before you can do the next release. Everything is organized around the product. Now we are talking about services. The bulk of our revenue is still products. That’s also where the gravity is. Somehow we have to start breaking that gravity and that’s hard. You have to find the right partners in the organization. It’s not just one person who is pushing and pulling. There are a couple of business leaders starting to drive in this direction. Philips has a CEO who is saying this is the direction we are taking and then you start seeing gradual change. We need to create momentum and that momentum will change the gravity.
How is the competitive landscape in the healthcare equipment domain and how do you ensure that you are creating value?
Competition is really interesting in this sector because it radically changes year after year. Last year IBM decided to invade our space as they bought Merge, Phytel and Truven. So we had to reevaluate how we deal with IBM because they are also a big supplier to us.
This week, Siemens and IBM decided to start working together, which is interesting because Siemens just established the Joint Venture with Cerner, a big healthcare IT company. Google is big time into this space. Everybody knows that Apple too decided to get into health. Having all the big guys enter our space is changing what we are doing. I heard someone talk about ecosystem. What we have decided is to create our own ecosystem, so we are hooking up with Amazon. We are competing with Qualcomm, but we decided together we are going to create the Internet of Medical Things. This is different from managing a supplier or distributor. Ecosystems that include customers and competitors are the future of digital business.